How ‘story maps’ redraw the world using people’s real-life experiences
By Lauren Drakopulos and Shefali Juneja Lakhina
Maps are an important part of our everyday lives.
We use them for driving directions, to look up restaurants or stores and parse election data. We can even use smartphone maps to locate friends when they’re out on the town.
What digital mapping tools like Google Maps or Citymapper generally don’t tell us is how a certain street got its name, or what issues are of critical cultural importance to a community.
But “story maps” – an interactive form of drawing the world around us and an increasingly popular form of mapping – can do all this and more.
As geographers, we believe story maps can also help people better understand such complex global issues as human rights, climate change and refugee resettlement.
Here are a few examples.
Untold histories
Story maps typically combine geographic maps with narrative text, images and multimedia content to tell a richer, often hidden story of a given place.
Julian Barr, a geographer at the University of Washington and an LGBTQ historian, has transformed a printed walking tour of Seattle’s Pioneer Square into a digitized, interactive self-guided tour of Seattle’s queer history.
The Pioneer Square walking tour, first created by the Northwest Lesbian and Gay History Museum Project in the late 1990s, was designed simply to commemorate the area’s history.
“It was conducted a couple of times a year to engage the public with a queer history that is not obvious or apparent,” Barr explains.
In 2017, Barr decided to make the tour available to a wider audience and offer it in a more interactive format. He took it online and added historical photographs from newspaper archives about Occidental Square, the site of major protests against a 1978 anti-lesbian bill, and on the backstory behind every gay bar in the area.
People can now learn more about how each stop on the walk has helped build Seattle’s local LGBTQ community since the 1890s.
“Digitizing the tour allowed me to make this important local history more accessible and engaging” for a broader audience, he says.
Personal journeys
Story maps can provide insights into the experiences of refugees as they settle into new lives far from home.
In 2017, as part of doctoral research at Australia’s University of Wollongong, interviews were conducted with 26 people from the Democratic Republic of Congo, Iran, Iraq, Liberia, Myanmar, Syria and Uganda about their experience of resettling in the Illawarra region of New South Wales, Australia.
The Illawarra is safer than the war zones the refugees fled. But it is also home to a range of seasonal hazards, including flooding, bush fires, hail, strong winds and lightning. Ten of the 26 refugees interviewed reported being caught unaware by severe weather during their first years of living in the Illawarra.
The detailed, hand-drawn charts that emerged from the interviews plot refugees’ experiences en route to Australia, showing their journey from “risks” – flooding, fire and the like – to the “safety” of family, neighbors and community.
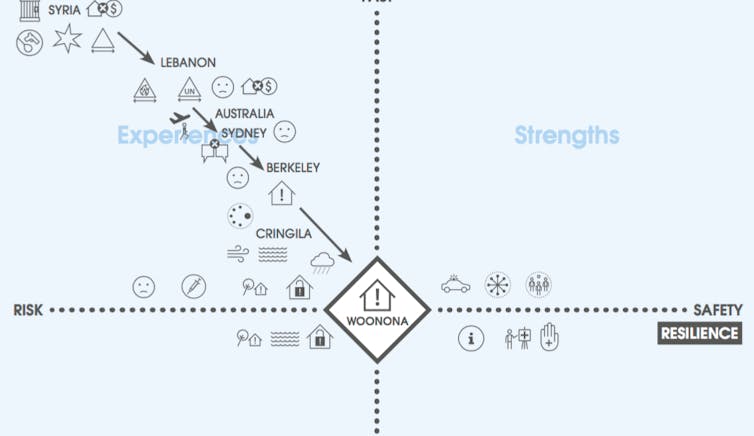
These charts, now available online in digital form, offer insight into how refugees apply their past disaster-survival experience to stay safe in Australia.
City councils, local emergency agencies and community groups are now working directly with former refugees to design more responsive and relevant disaster preparedness and response services in the Illawarra.
Mapping climate change
Story mapping can even be done in places with little or no regular internet access by building on the visual and oral mapping traditions of local communities.
In 2016, University of Washington professor Jin-Kyu Jung, working with Ecuadorian subsistence farmers, used Post-It notes to facilitate a community discussion on climate change.
“The locals have a very limited understanding of maps,” Jung told us. “And they really couldn’t precisely point out where climate changes are happening.”
So Jung asked 16 male and female farmers from the Ticatilin-Marcaló Grande community in the mountainous central Ecuadorian province of Cotopaxi to answer three questions: Has your community changed since you were a child? How has the climate changed since then? Are there any past climate-related events that affected you the most?
They wrote their answers on Post-It notes and stuck them on a map of the area.
The result was a deeply personal and geographically detailed narrative about climate change in this swath of the high Andes.
Farmers observed that local grasslands were drying up, making food and water for livestock harder to find. Some said they had changed how they farmed in response. Others prayed before heading to their fields for the harvest, understanding severe climate events as a punishment from “taitita (father) God.”
Jung hopes his story maps – along with the journal article that they helped inform – can help Ecuadorian policymakers design responsive and relevant climate policies for the Andean region.
What story maps can teach us next
The three projects outlined here are just a snapshot of a much broader universe of story maps.
Story mapping is a versatile tool for engaging with people whose tales often go untold, informing how communities and governments think about the history and future of the places they call home.
By making uber-local or highly personal experiences more visible, story maps have the potential to tell a more nuanced, complex story about some of the most important issues of the day, from globalization to migration and beyond.
Our research suggests its power as a storytelling tool, not for just geographers but activists, policymakers and neighborhoods alike.