Ten charts to discover the European State of the Climate 2025 report

Europe is Earth’s fastest-warming continent. In 2025, the continent saw record heatwaves from the Mediterranean to the Arctic, over land and in the ocean.
As the climate warms, impacts are widespread – from loss of glacier ice to widespread drought, and impacts on biodiversity.
The European State of the Climate (ESOTC) 2025 offers an overview of the climate during the previous year through a detailed analysis of key climate variables. In addition to the numerous visuals highlighted in the report, one of the additional resources available is the ‘Graphics gallery’ featuring 142 charts and maps, plus a set of eight infographics. For each, the images and the corresponding data are freely and openly available to download. Here we describe a selection of the charts and graphics to illustrate the variety presented in the report .
Why is Europe warming so quickly?
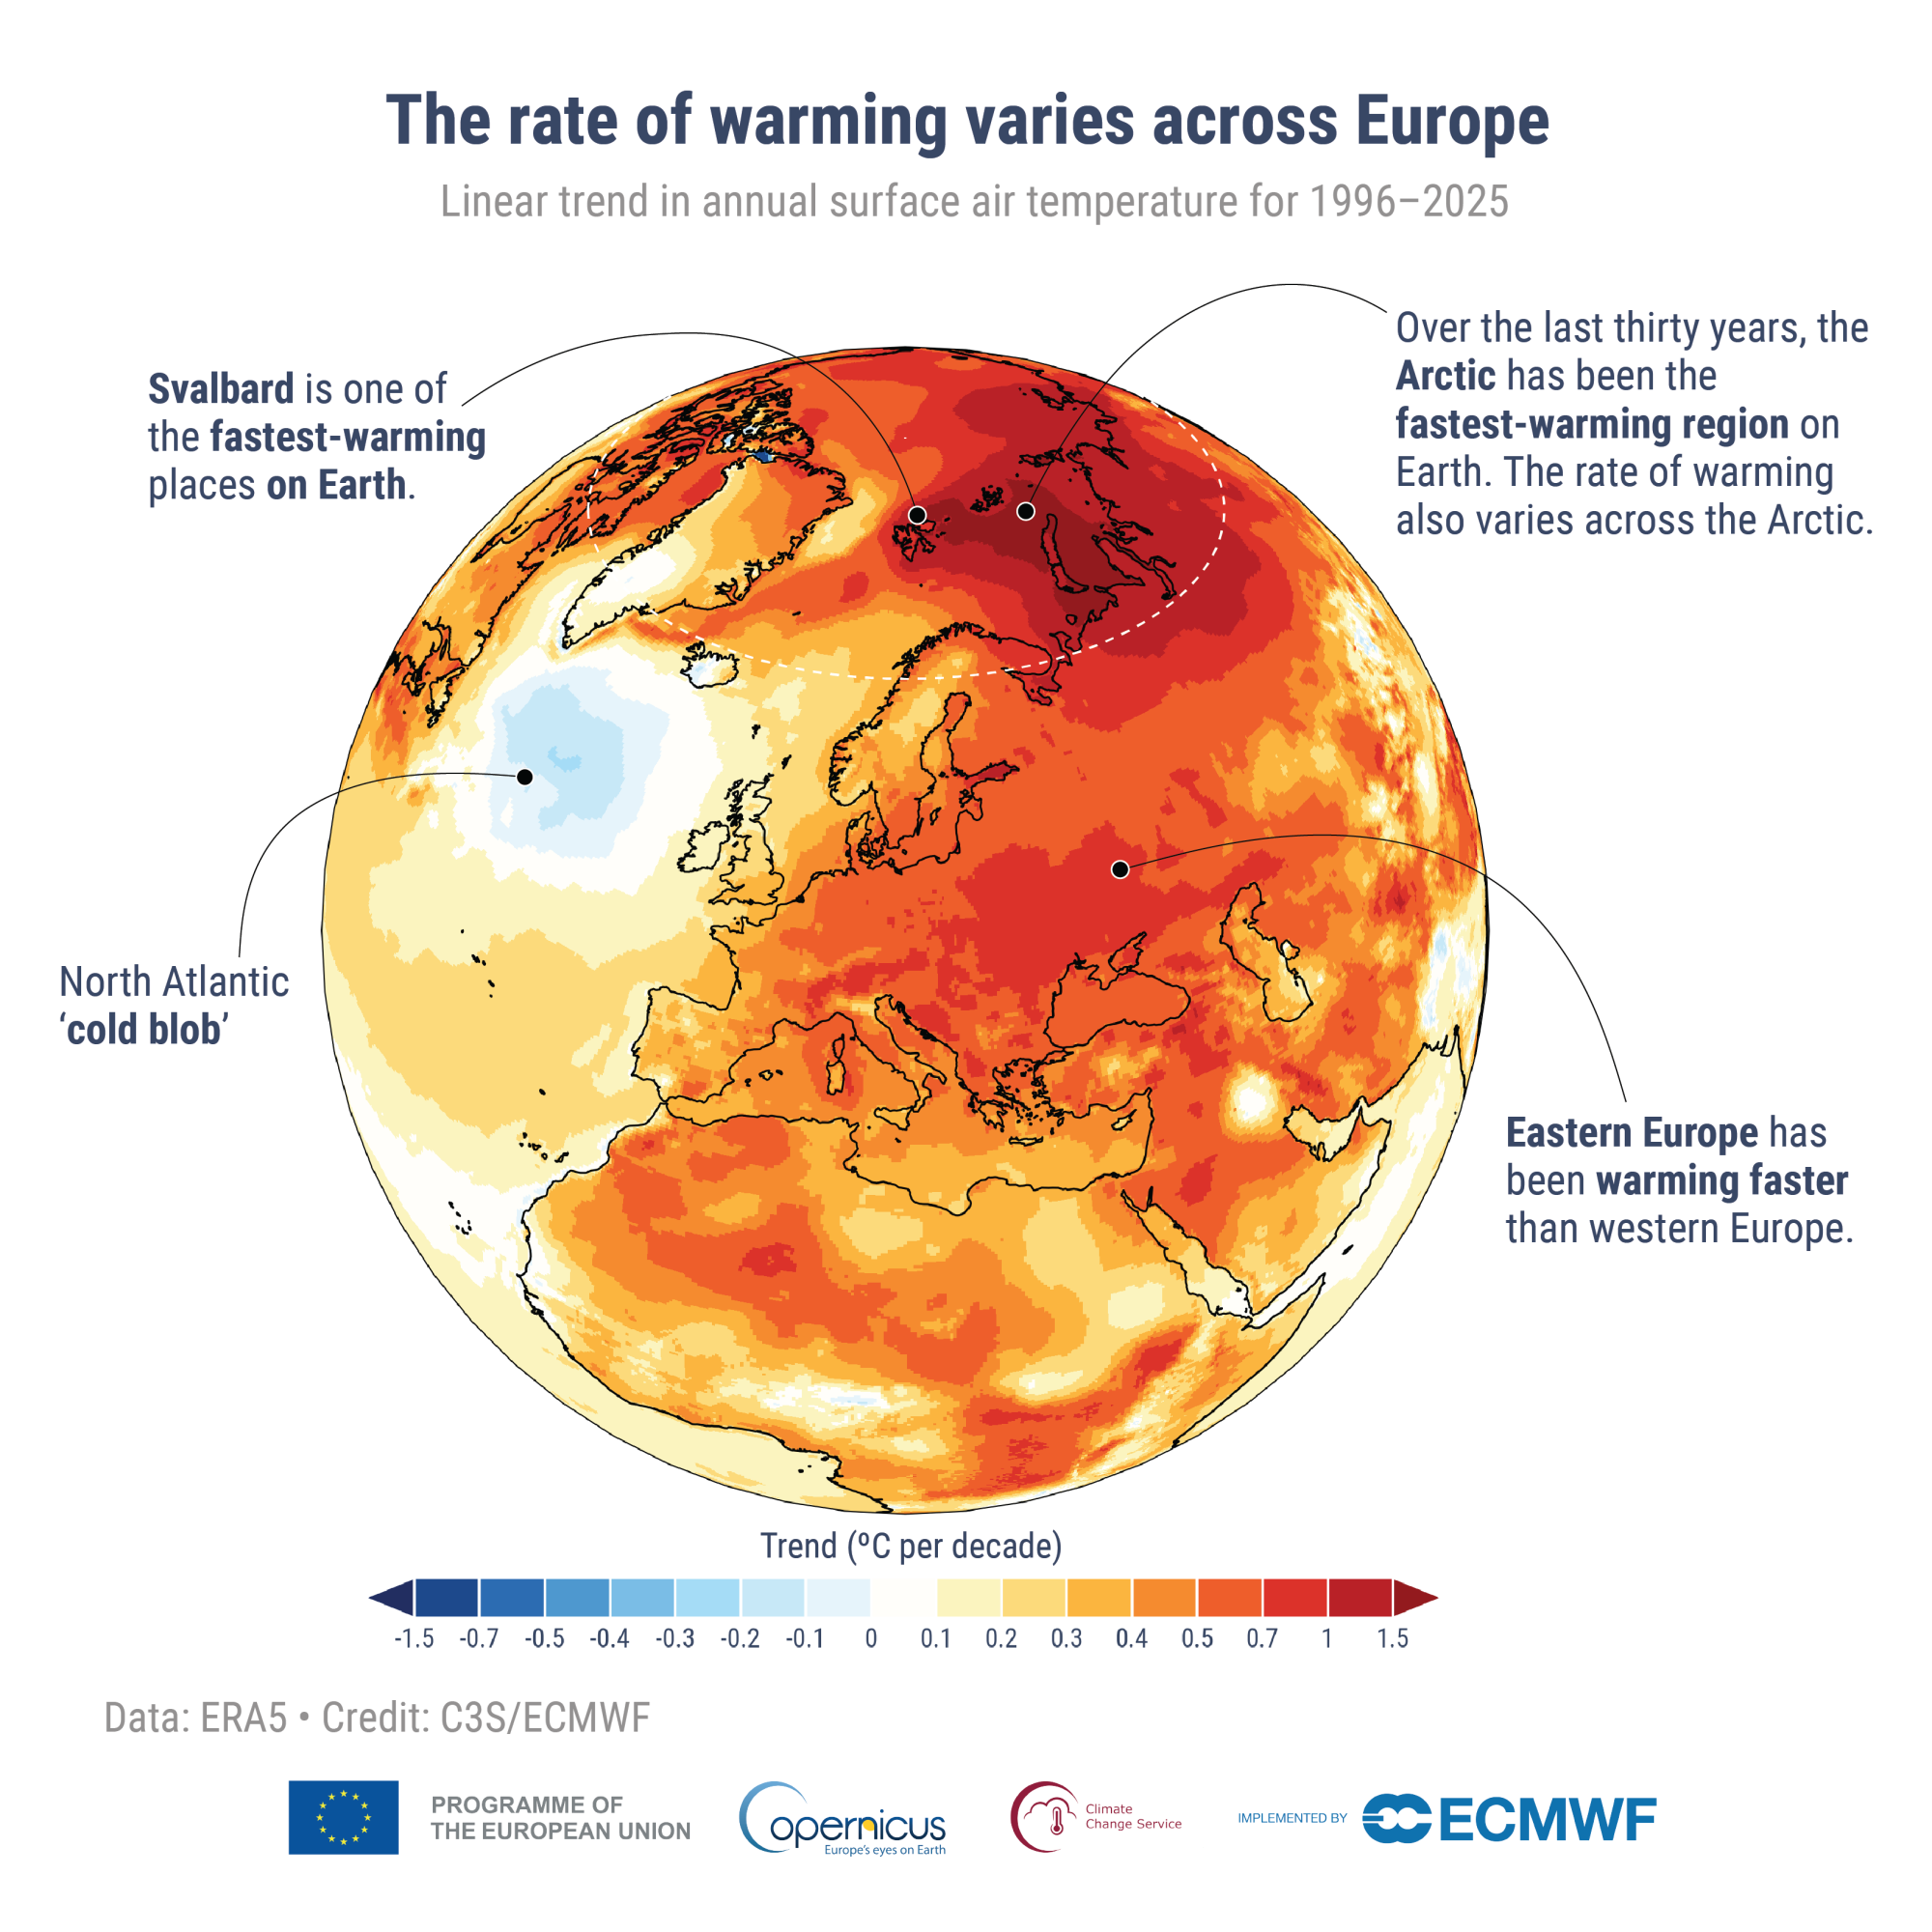
Europe is warming more than twice as fast as the global average. This edition of the report, issued jointly by the Copernicus Climate Change Service (C3S), implemented by the European Centre for Medium-Range Weather Forecasts (ECMWF), and the World Meteorological Organization (WMO), starts with an overview of why Europe is warming faster than all the other continents. A map is included that shows the trend in annual surface air temperature over the last thirty years. The graphic, based on the flagship reanalysis dataset from C3S, ERA5 , highlights that the rate of warming also varies within Europe, with eastern Europe warming faster than western Europe, while the Arctic is the fastest-warming region on Earth.
Almost all of Europe saw above-average temperatures in 2025
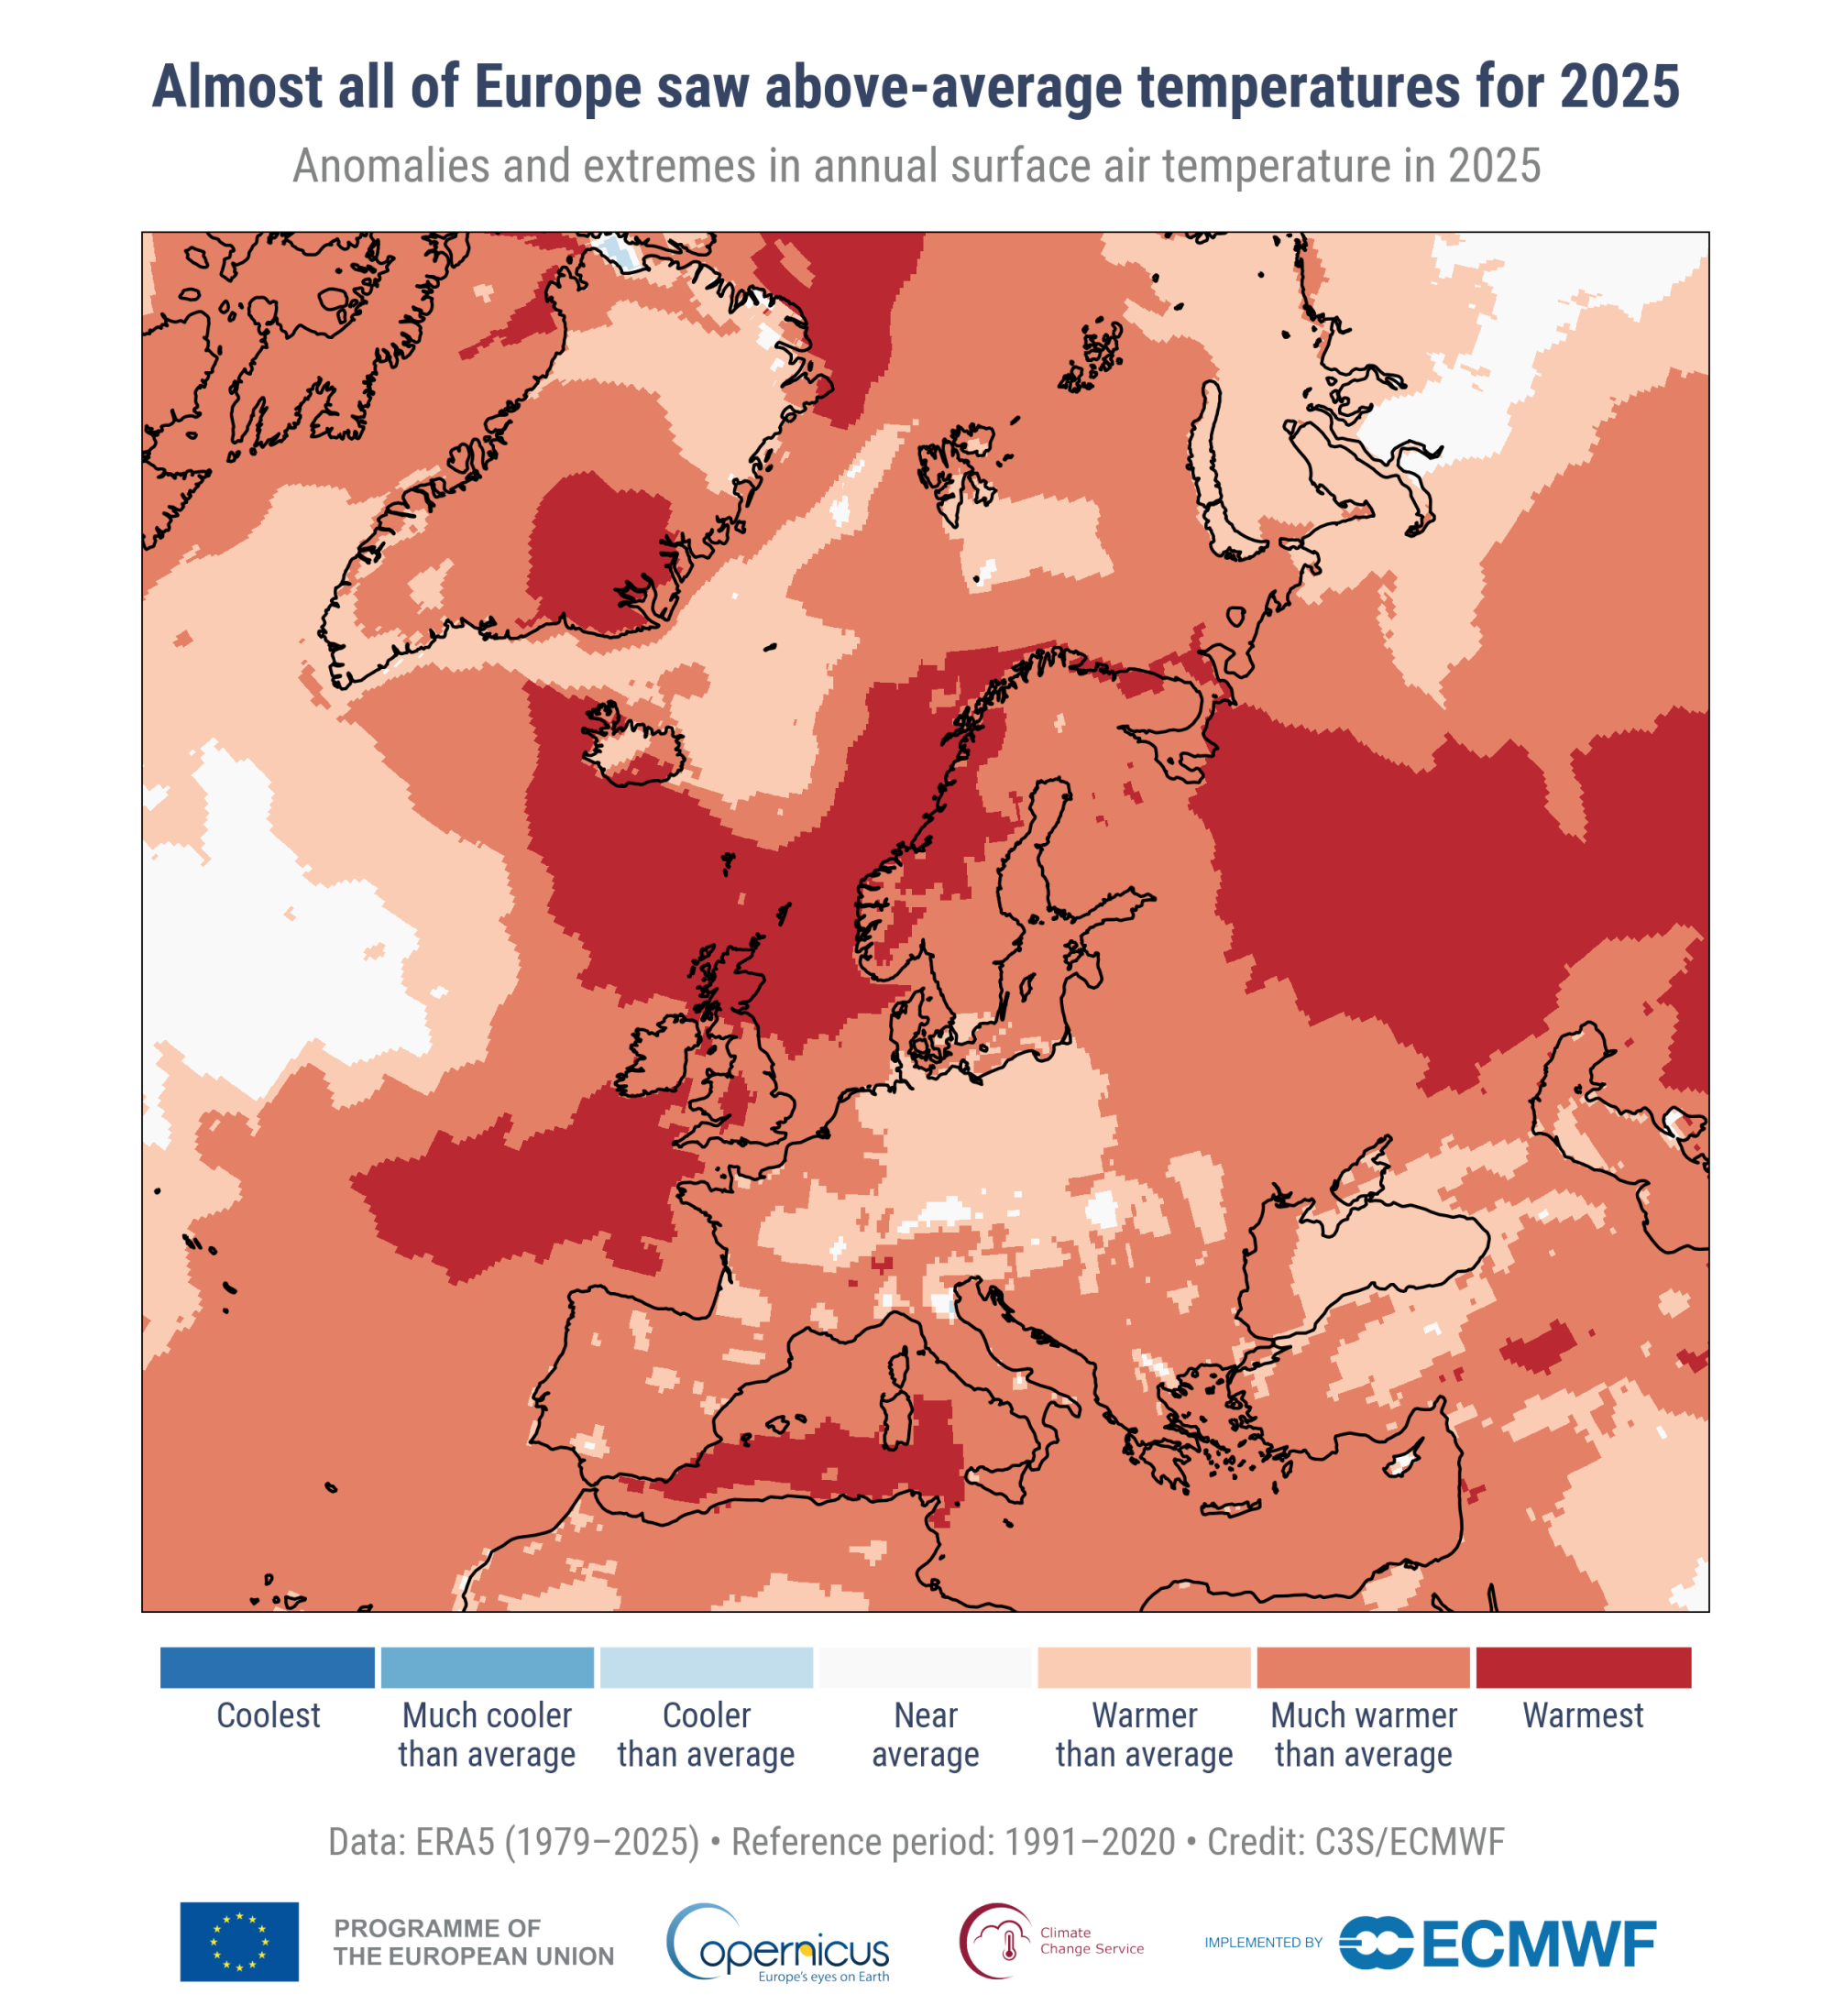
At least 95% of Europe saw above-average temperatures in 2025. This map, included in the ‘ Temperature ’ section of the report, reveals the areas that experienced their warmest annual temperature on record. Overall, several northern countries saw their warmest (United Kingdom, Norway and Ireland) or second warmest (Ireland, Sweden and Finland) year on record. A large proportion of the continent saw warmer or much warmer-than-average temperatures. Only a few small areas saw close-to-average or slightly cooler-than-average temperatures.
Heat stress is increasing while cold stress declines
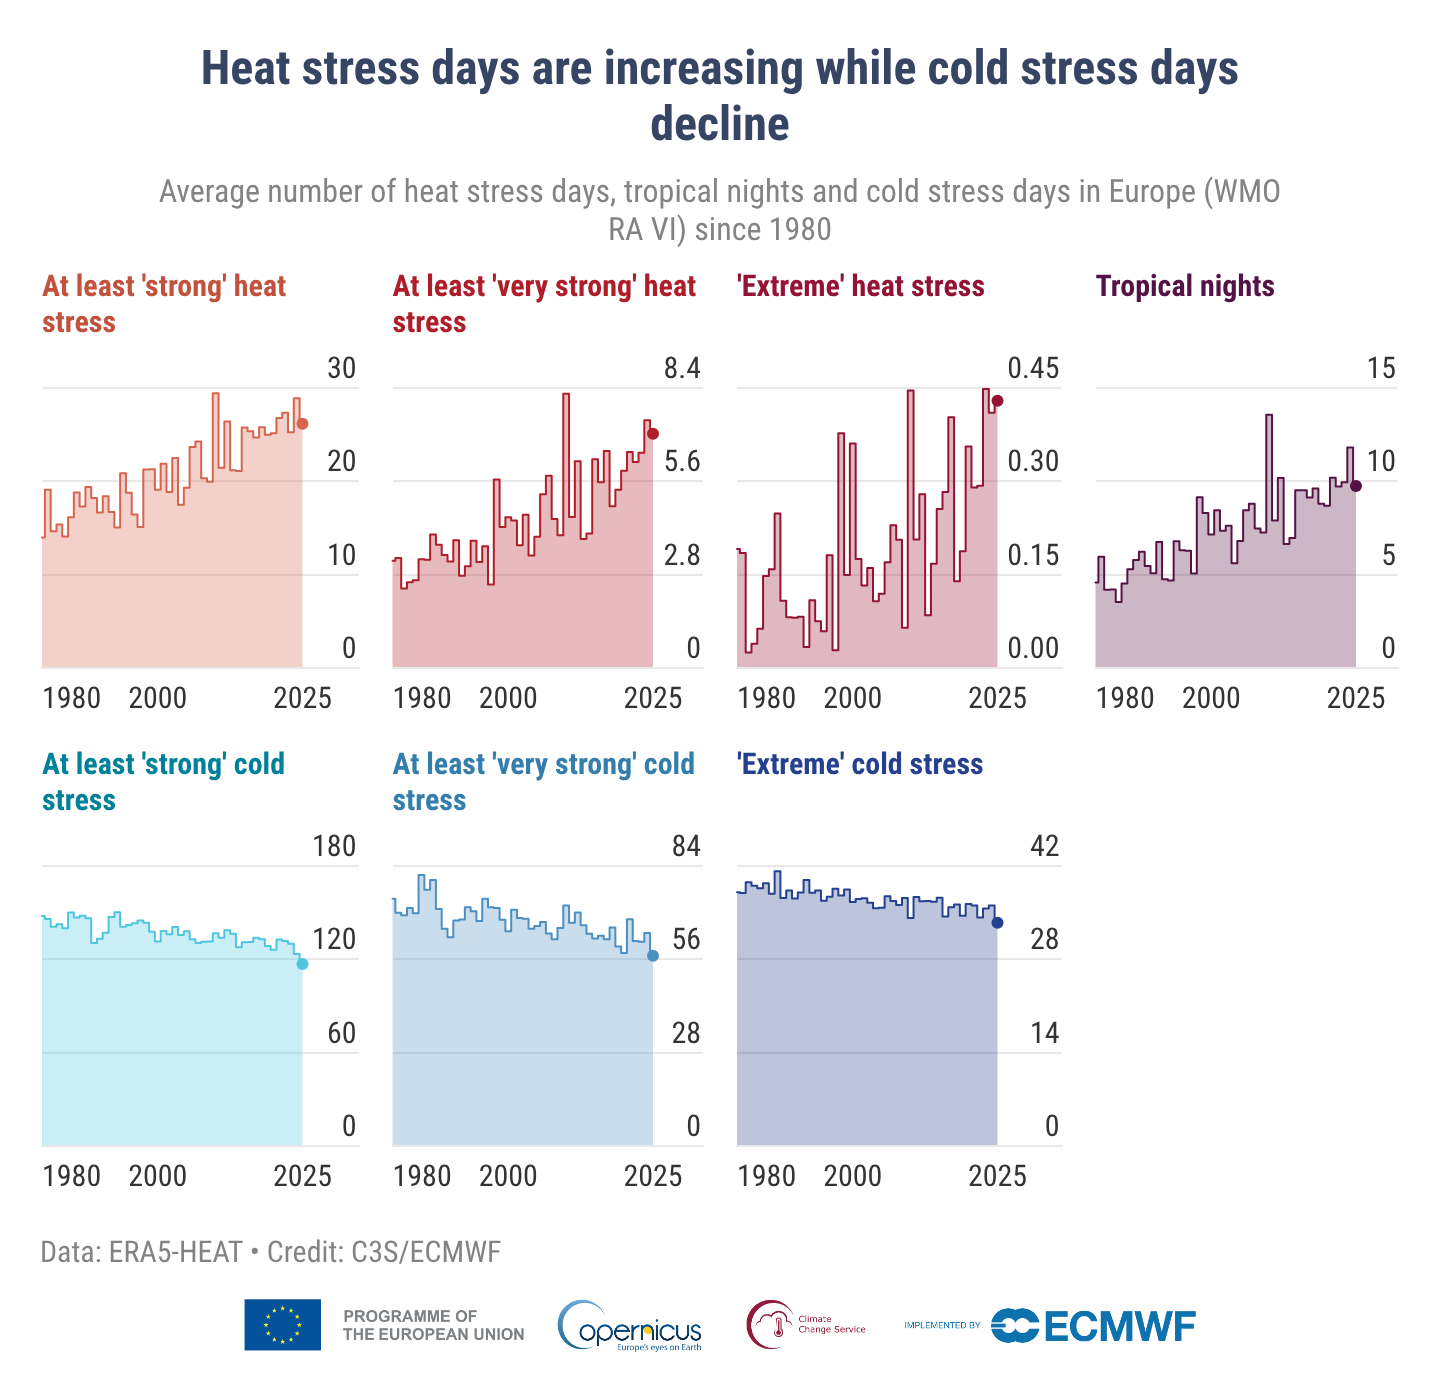
In 2025, there was a record low number of cold stress days in Europe, and 90% of the region saw fewer days than average with at least ‘strong’ cold stress. The report highlights that, for Europe as a whole, the number of heat stress days is increasing, and 2025 saw extreme heatwaves from the Mediterranean to the Arctic Circle, including Europe’s second most severe heatwave on record. The chart below, included in the ‘ Thermal stress‘ section, shows the long-term increase in heat stress and reduction of cold stress in Europe.
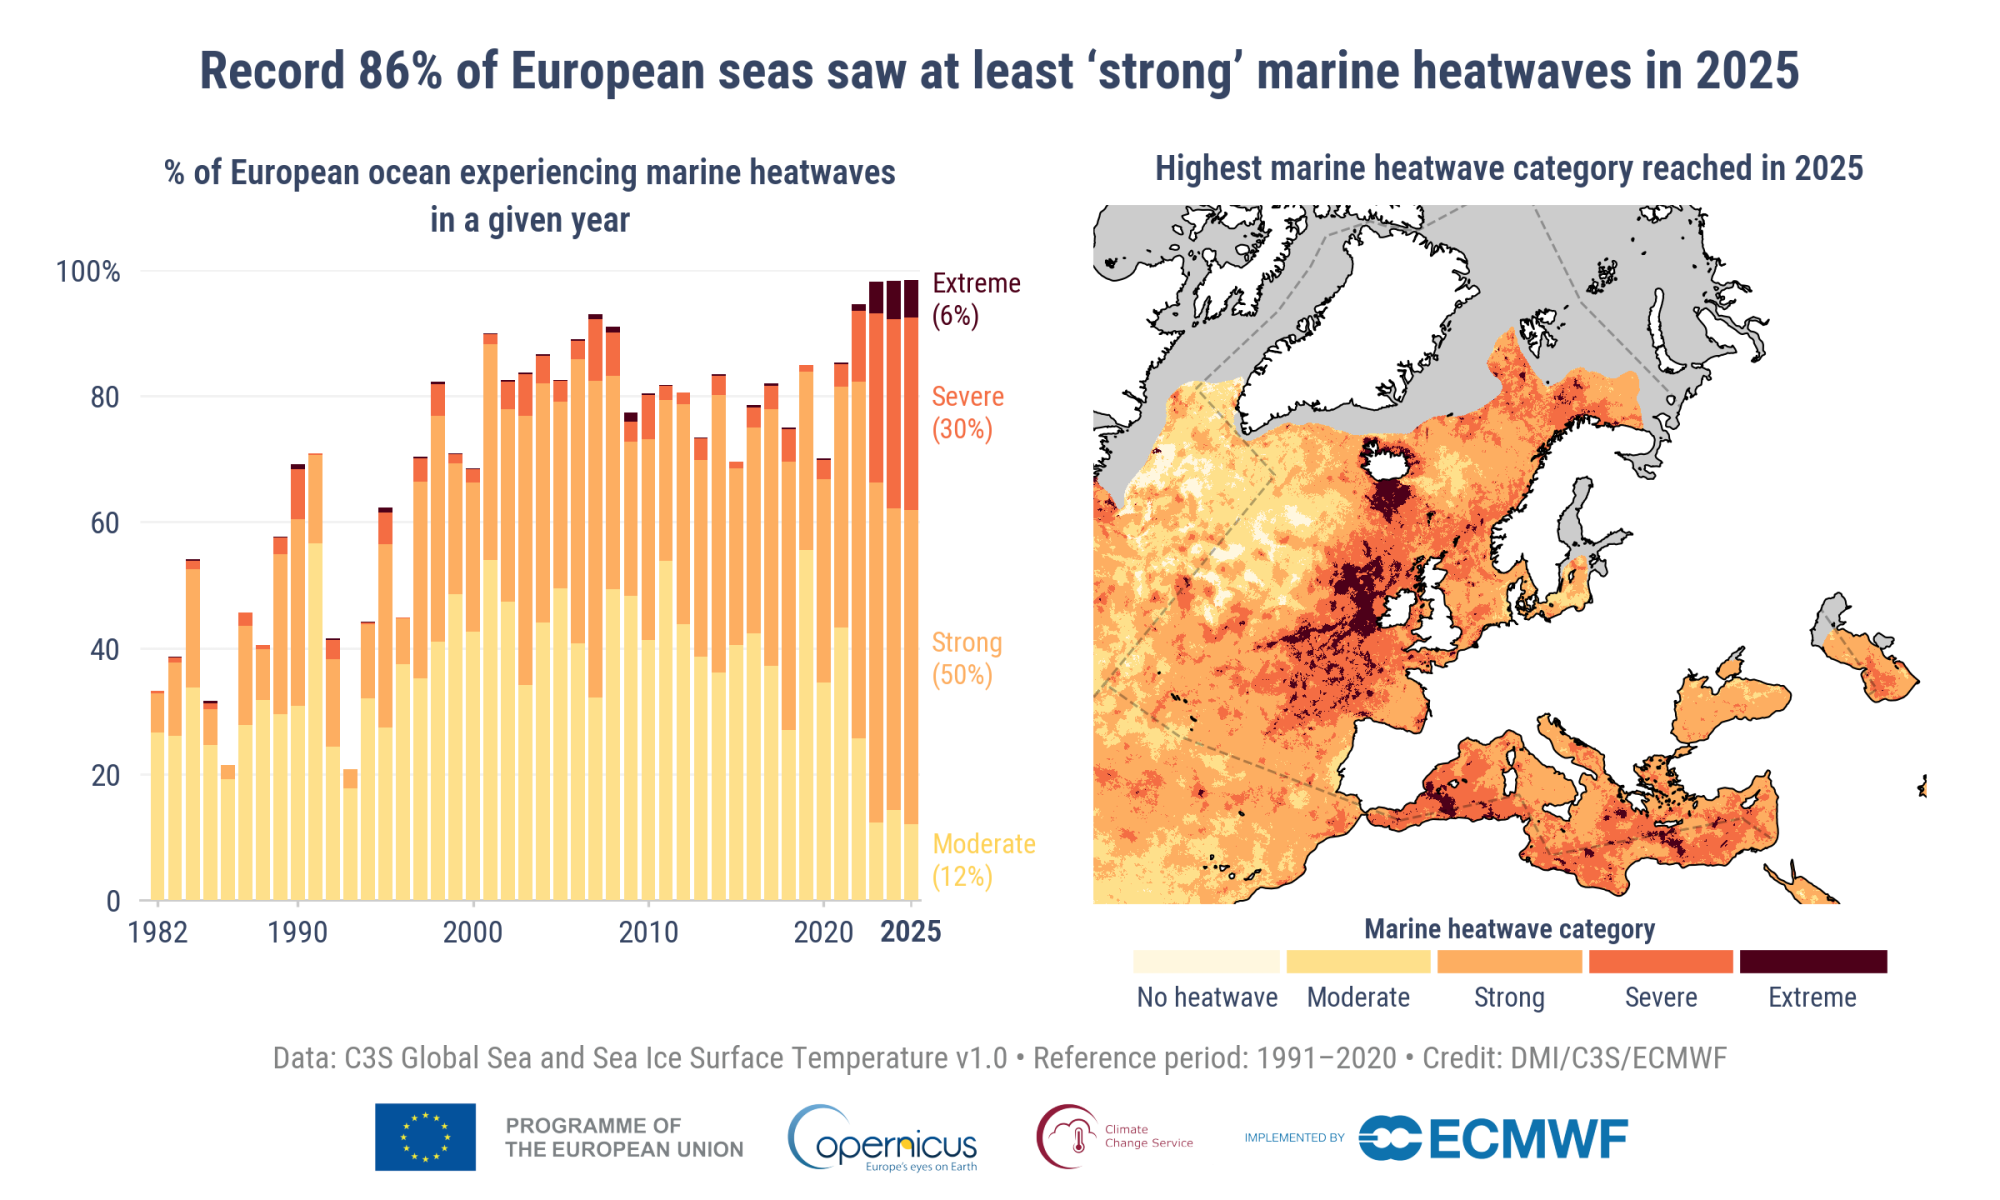
Record-high ocean temperatures
The annual average sea surface temperature (SST) for the European region was the highest on record for the fourth consecutive year. The ‘ Ocean ’ section of the report offers analysis and a set of visuals highlighting the evolution of SST since 1982, and for the first time includes new analysis on marine heatwaves across the region and changes over time. The proportion of the region affected by marine heatwaves has increased over recent decades, with a record 86% experiencing at least ‘strong’ marine heatwave conditions in 2025.
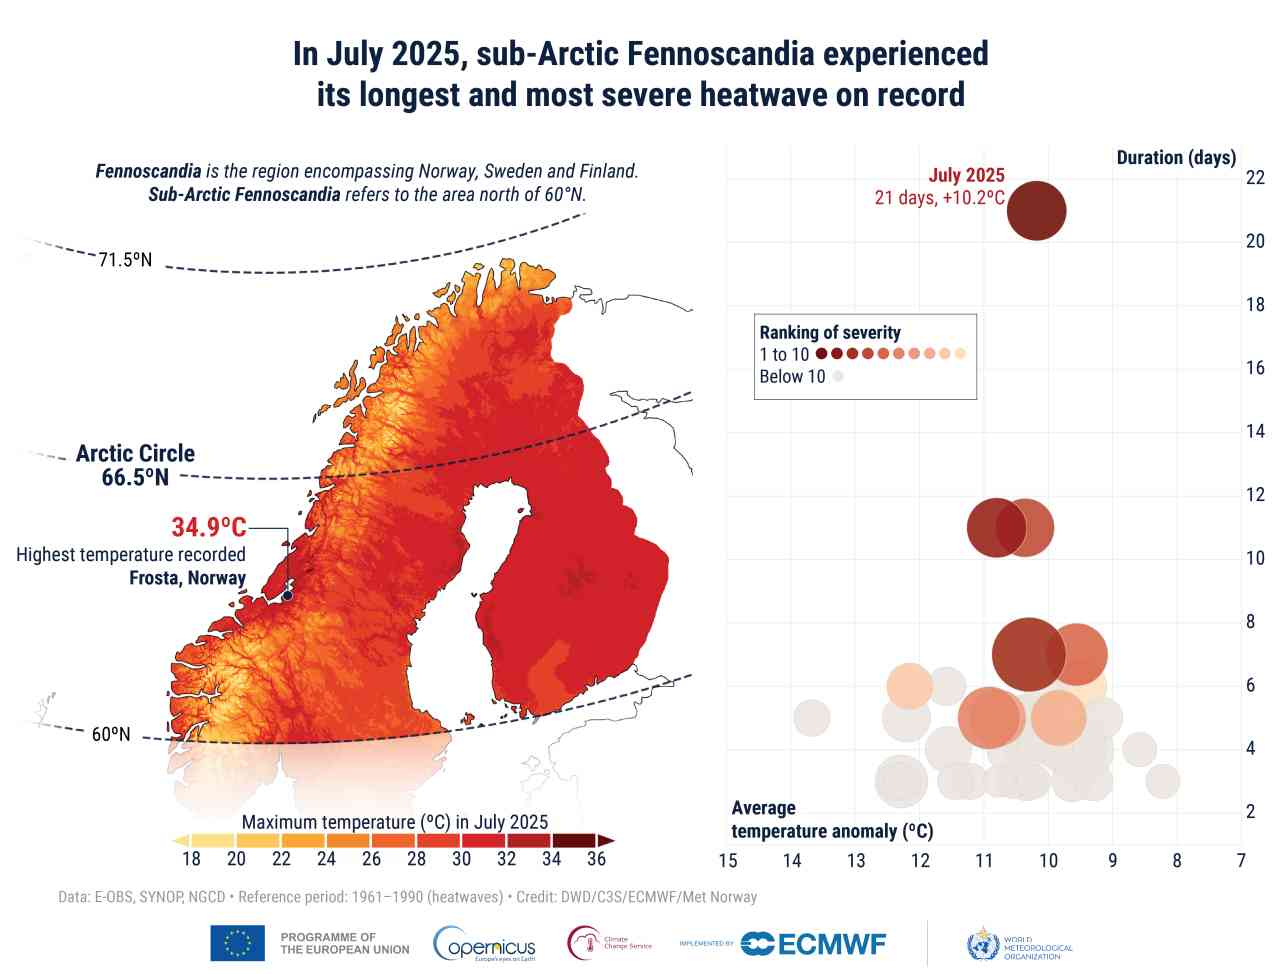
Exceptional heatwave in Fennoscandia
As the climate warms, heatwaves are becoming more frequent. In 2025, a long and intense heatwave affected sub-Arctic Fennoscandia from mid-July to early August. Lasting 21 days and with temperatures reaching or exceeding 30ºC, it was the longest and most severe on record for the region. A ‘ Spotlight ’ section of the report discusses this heatwave in detail. A dedicated infographic, shown below, is contained in the ESOTC 2025 Summary.
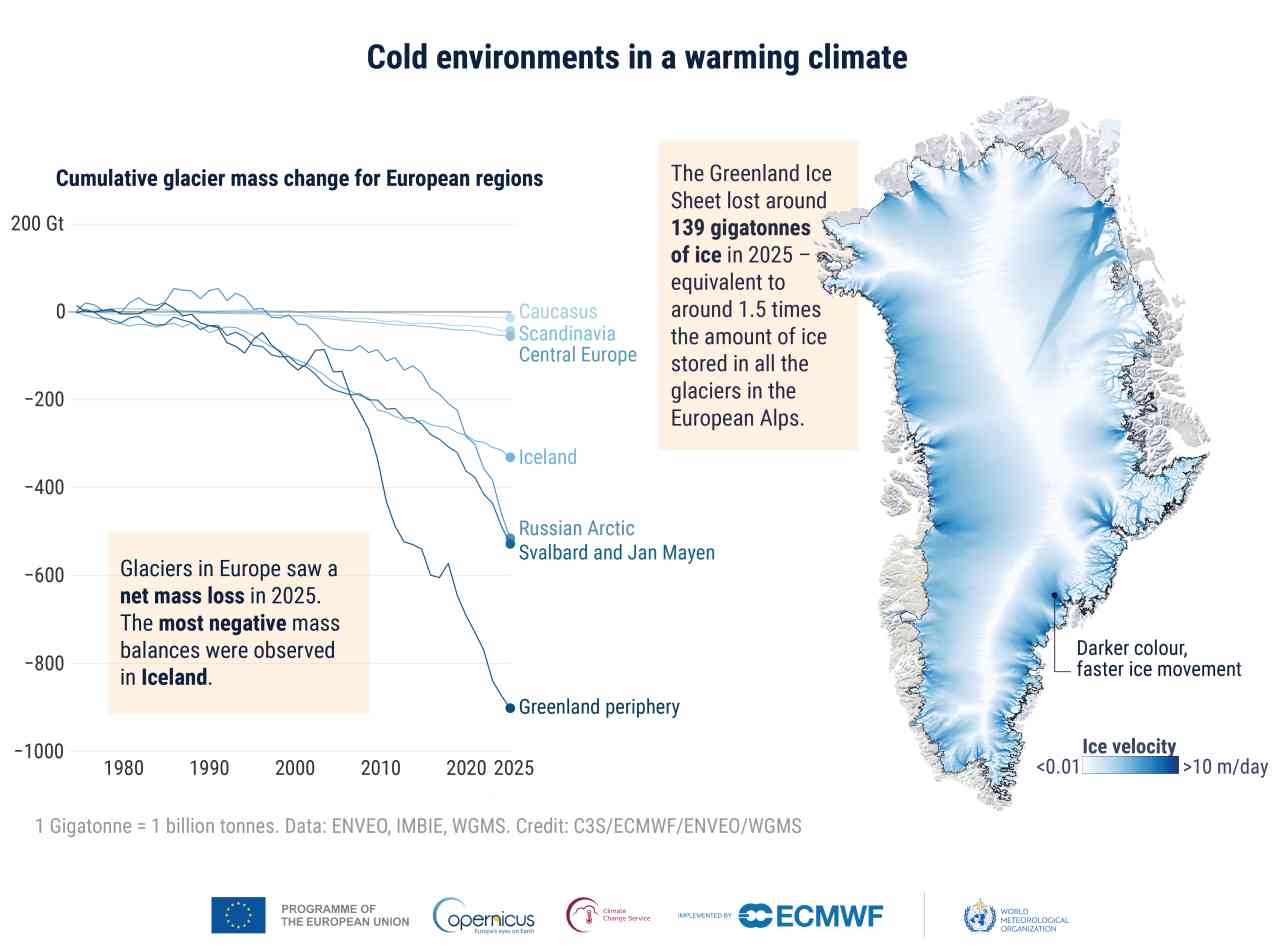
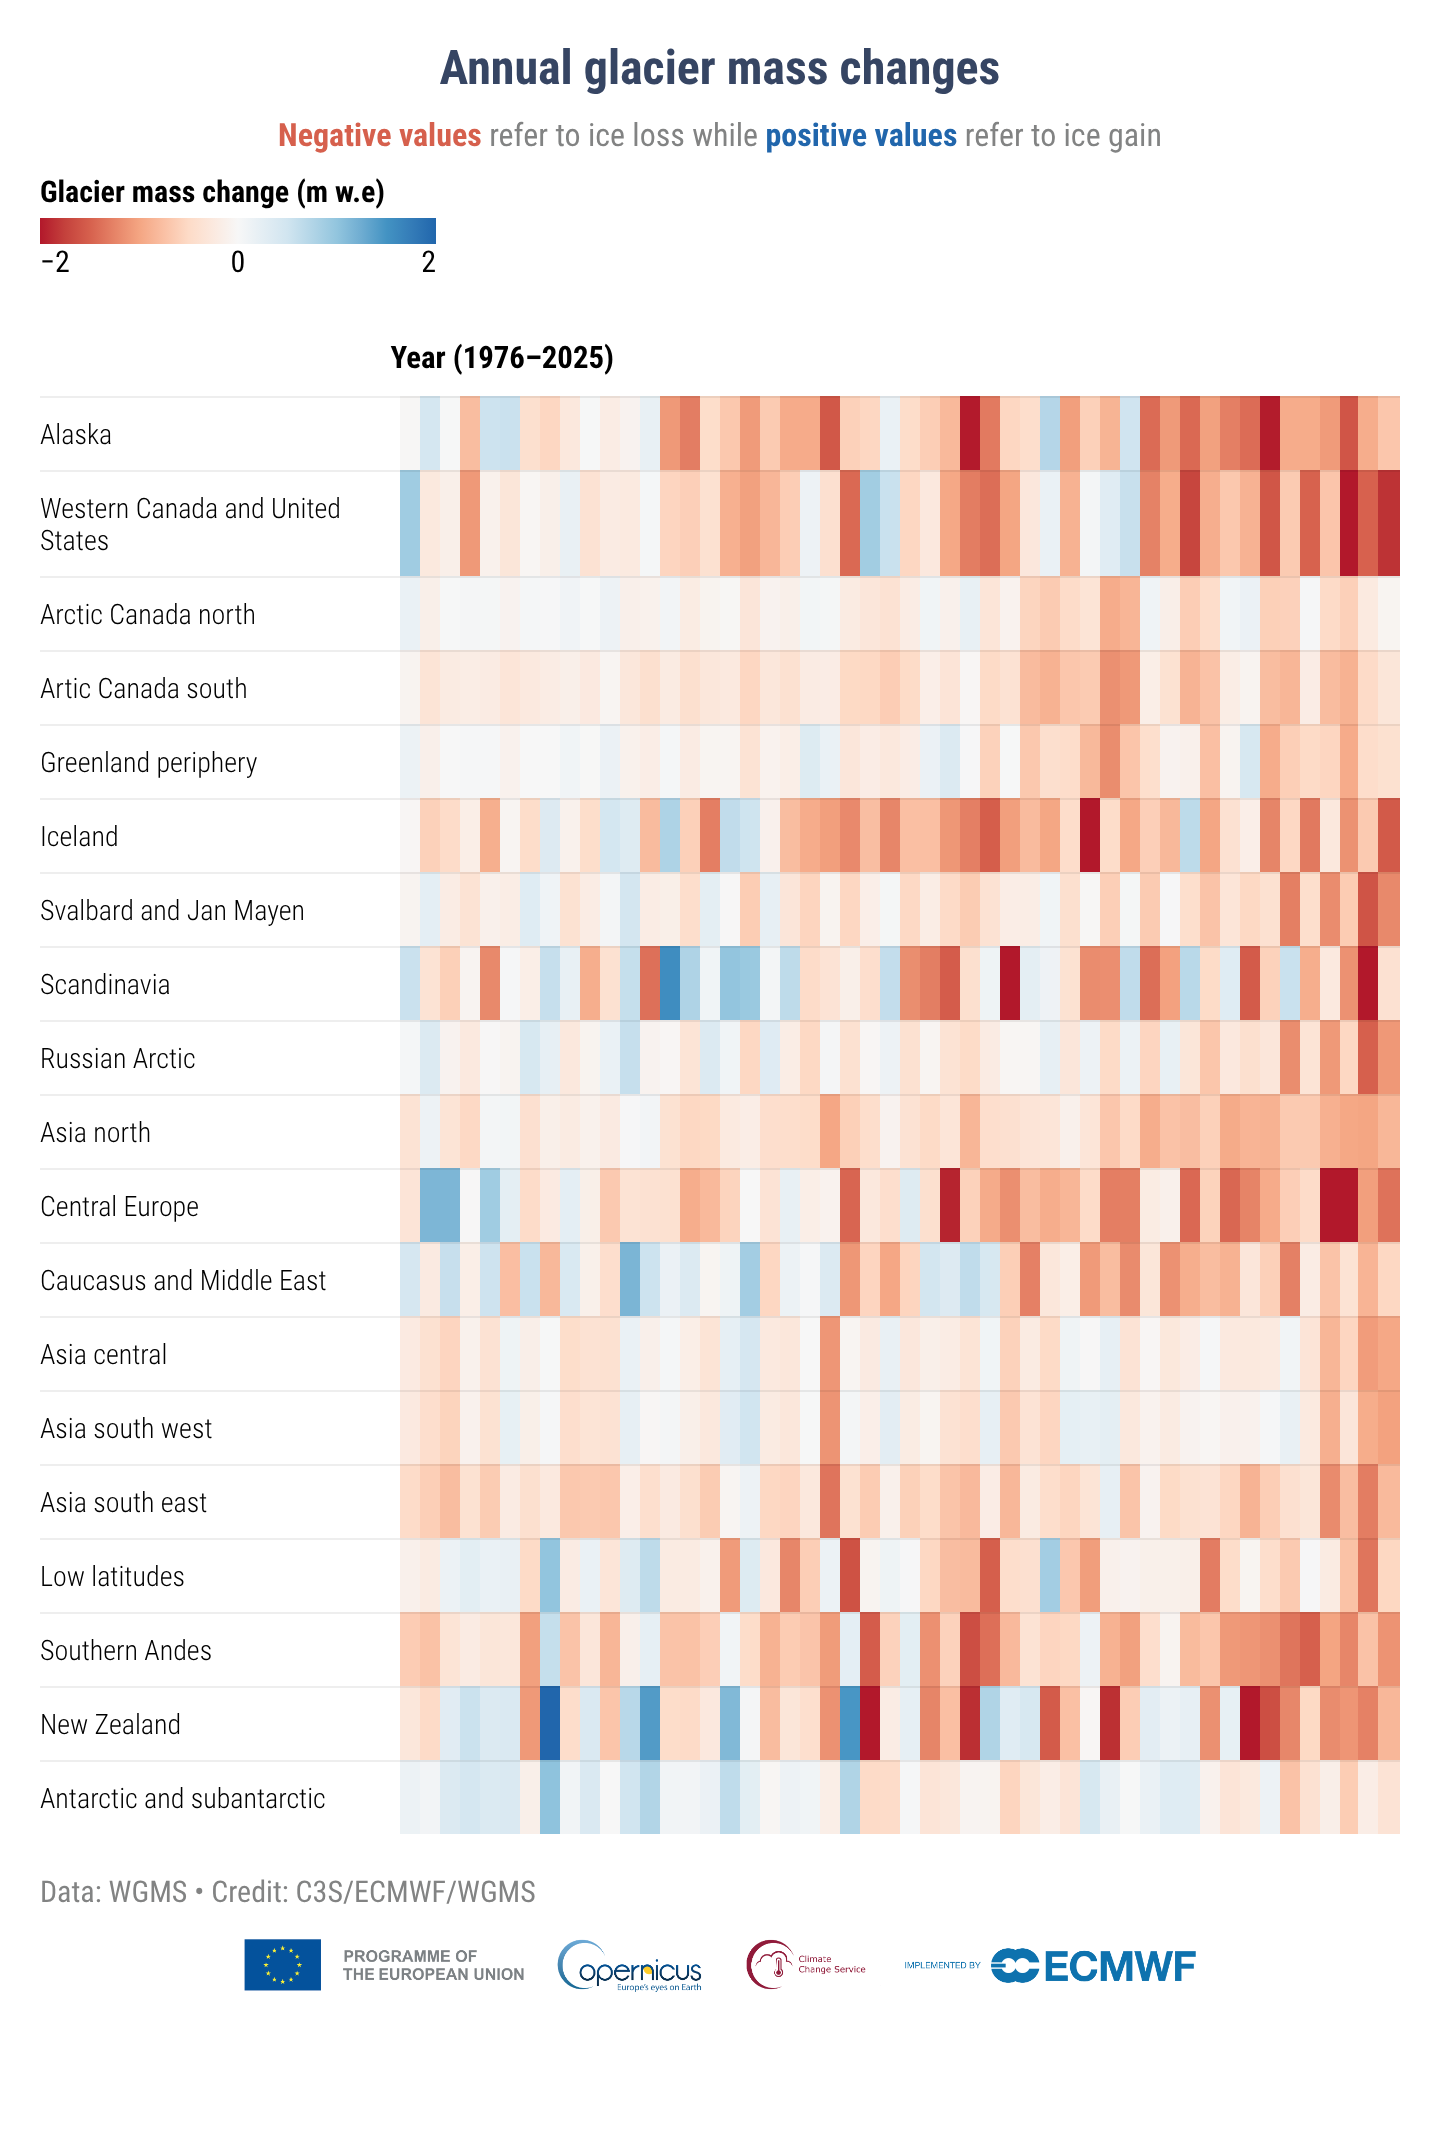
Our changing cryosphere
ESOTC 2025 includes a new section dedicated to analysis and discussion of the Greenland Ice Sheet in 2025 and long-term trends for the ice sheets. The ‘ Snow ’ section also includes newly available datasets to expand the analysis and provide additional perspectives. Alongside sections on ‘ Glaciers ’ and ‘ Arctic sea ice ', the report gives a comprehensive picture of our changing cryosphere.
The Greenland Ice Sheet lost around 139 Gt (139 billion tonnes) of ice in the 2025 hydrological year (1 October 2024–30 September 2025), raising the global mean sea level by 0.4 mm. This net mass loss is equivalent to about 1.5 times the amount of ice stored in all the glaciers in the European Alps. 2025 was the 29th consecutive year of net mass loss from the Greenland Ice Sheet, and the loss was about 9% below the annual average. The visual below is an excerpt of one of the infographics contained in the ESOTC 2025 Summary, featuring key findings about mass change in European glacier regions.
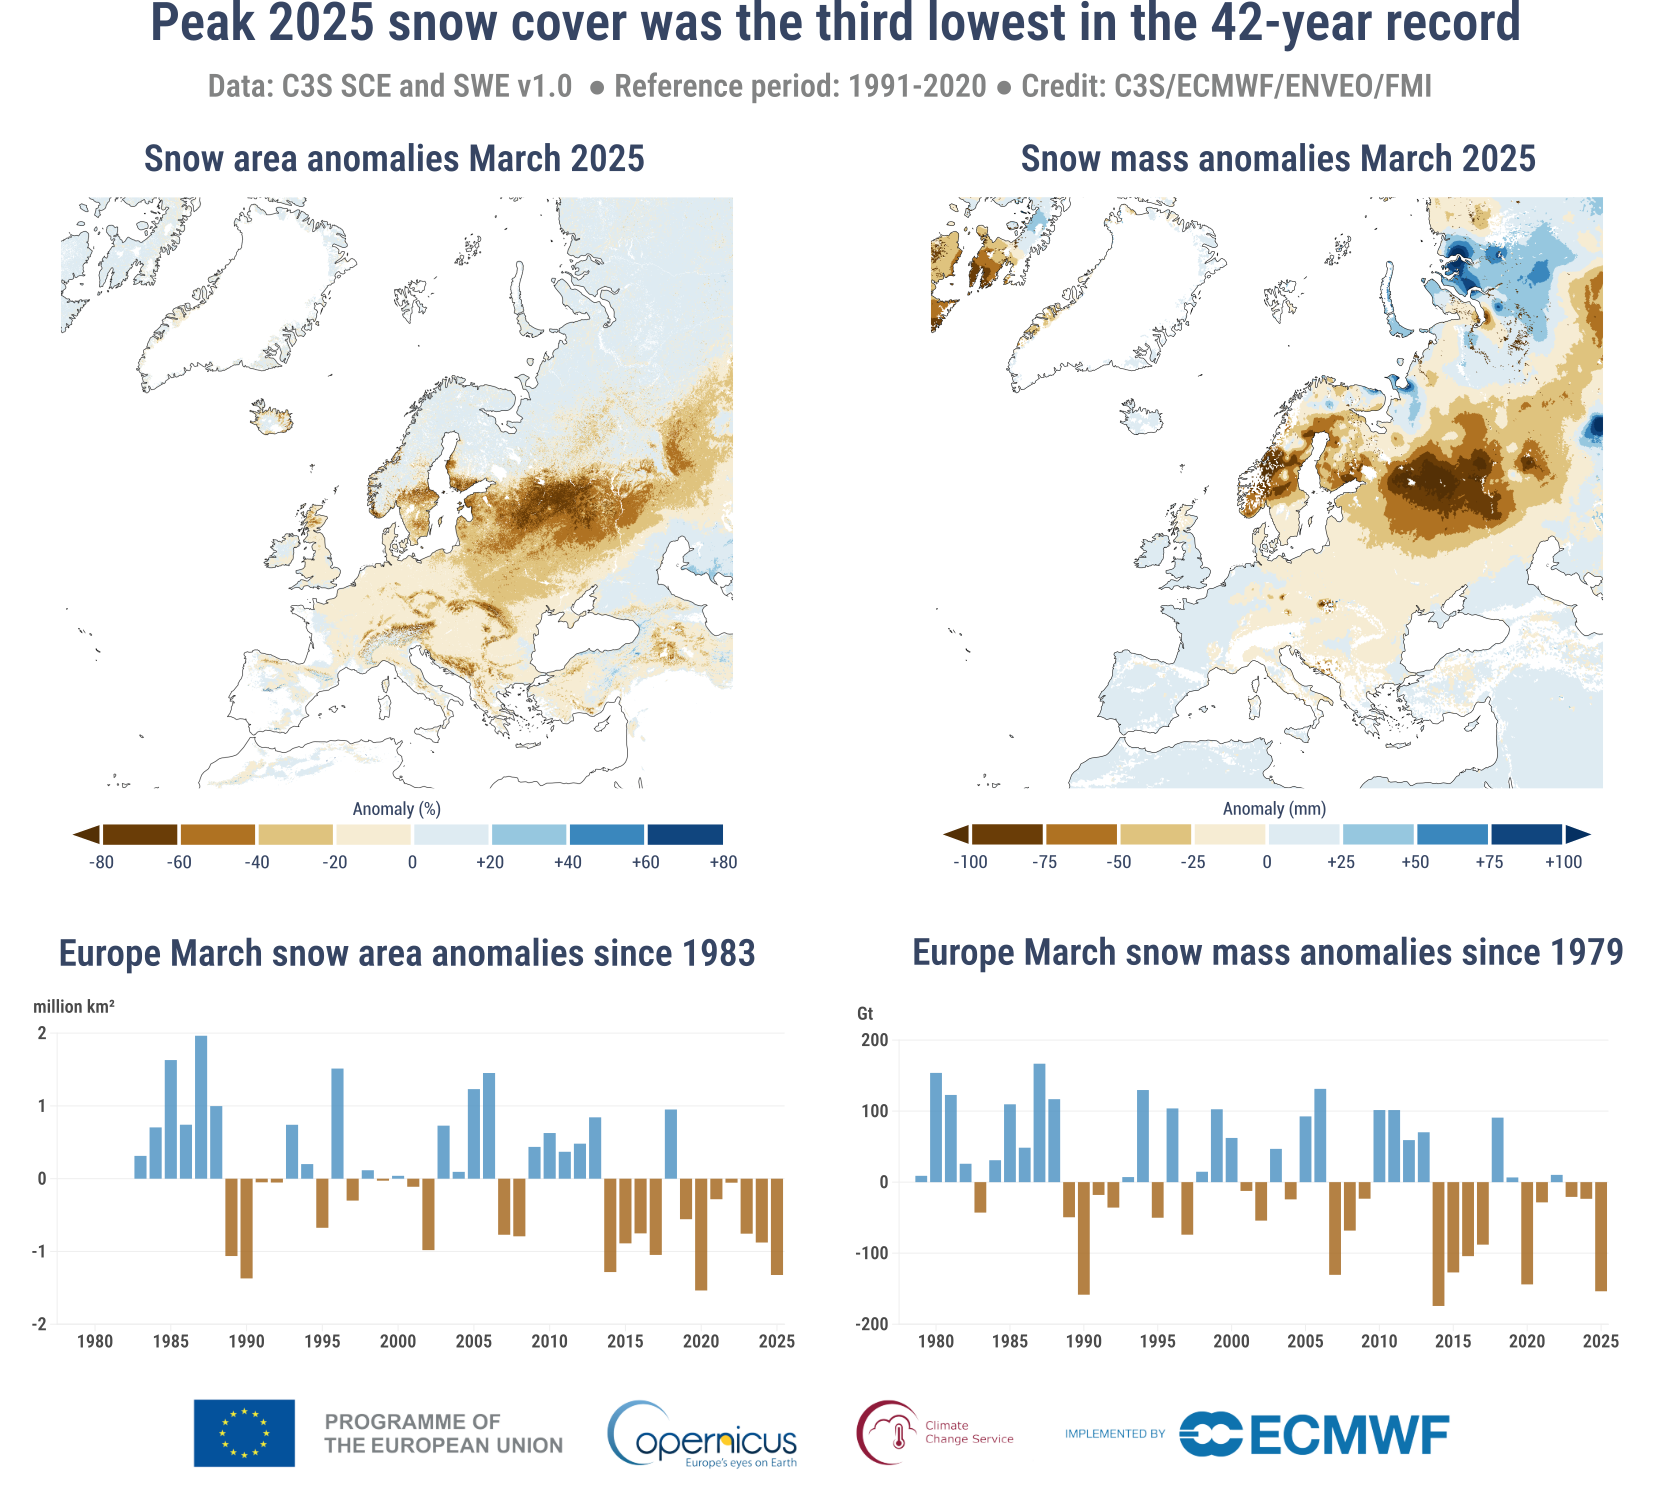
Snow cover amongst the lowest in four decades
This year, for the first time, the report looks at the snow cover across Europe. In addition to fewer snow days than average for most of the continent, the report looked at the peak 2025 snow cover, which takes place in March. During March 2025, the snow-covered area in Europe was 31% below the 1991–2020 average of 4.24 million km2, the third lowest snow extent since 1983 and not far from the lowest value, observed at 36% below average in 2020, and the second lowest of 32% below average in 1990. The data also show the snow mass anomaly that was 45% below average in 2025 at 154 Gt (154 billion tonnes).
Renewables supplied nearly half of Europe’s electricity in 2025
Renewables provided nearly half of Europe’s electricity in 2025, with solar power setting a new contribution record, at 12.5%. Considering solar, wind and hydropower together, renewables have generated more electricity than fossil fuels every year since 2023. In 2025, there was a mixed picture for climate-driven potential for power generation from solar PV, with above-average potential in a swathe from northwestern to central and eastern Europe, and below-average potential in much of southern and parts of northern Europe. This generally reflects the sunshine and solar radiation conditions. In contrast, potential power generation from onshore wind was generally below average, reflecting below-average wind conditions across the continent. Despite this, wind power contributed 18% of Europe’s total actual electricity generation, only slightly below the share in 2024 (18.4%) and 2023 (18.2%), reflecting the fact that weaker winds were at least partially offset by increased installed onshore wind capacity in Europe.

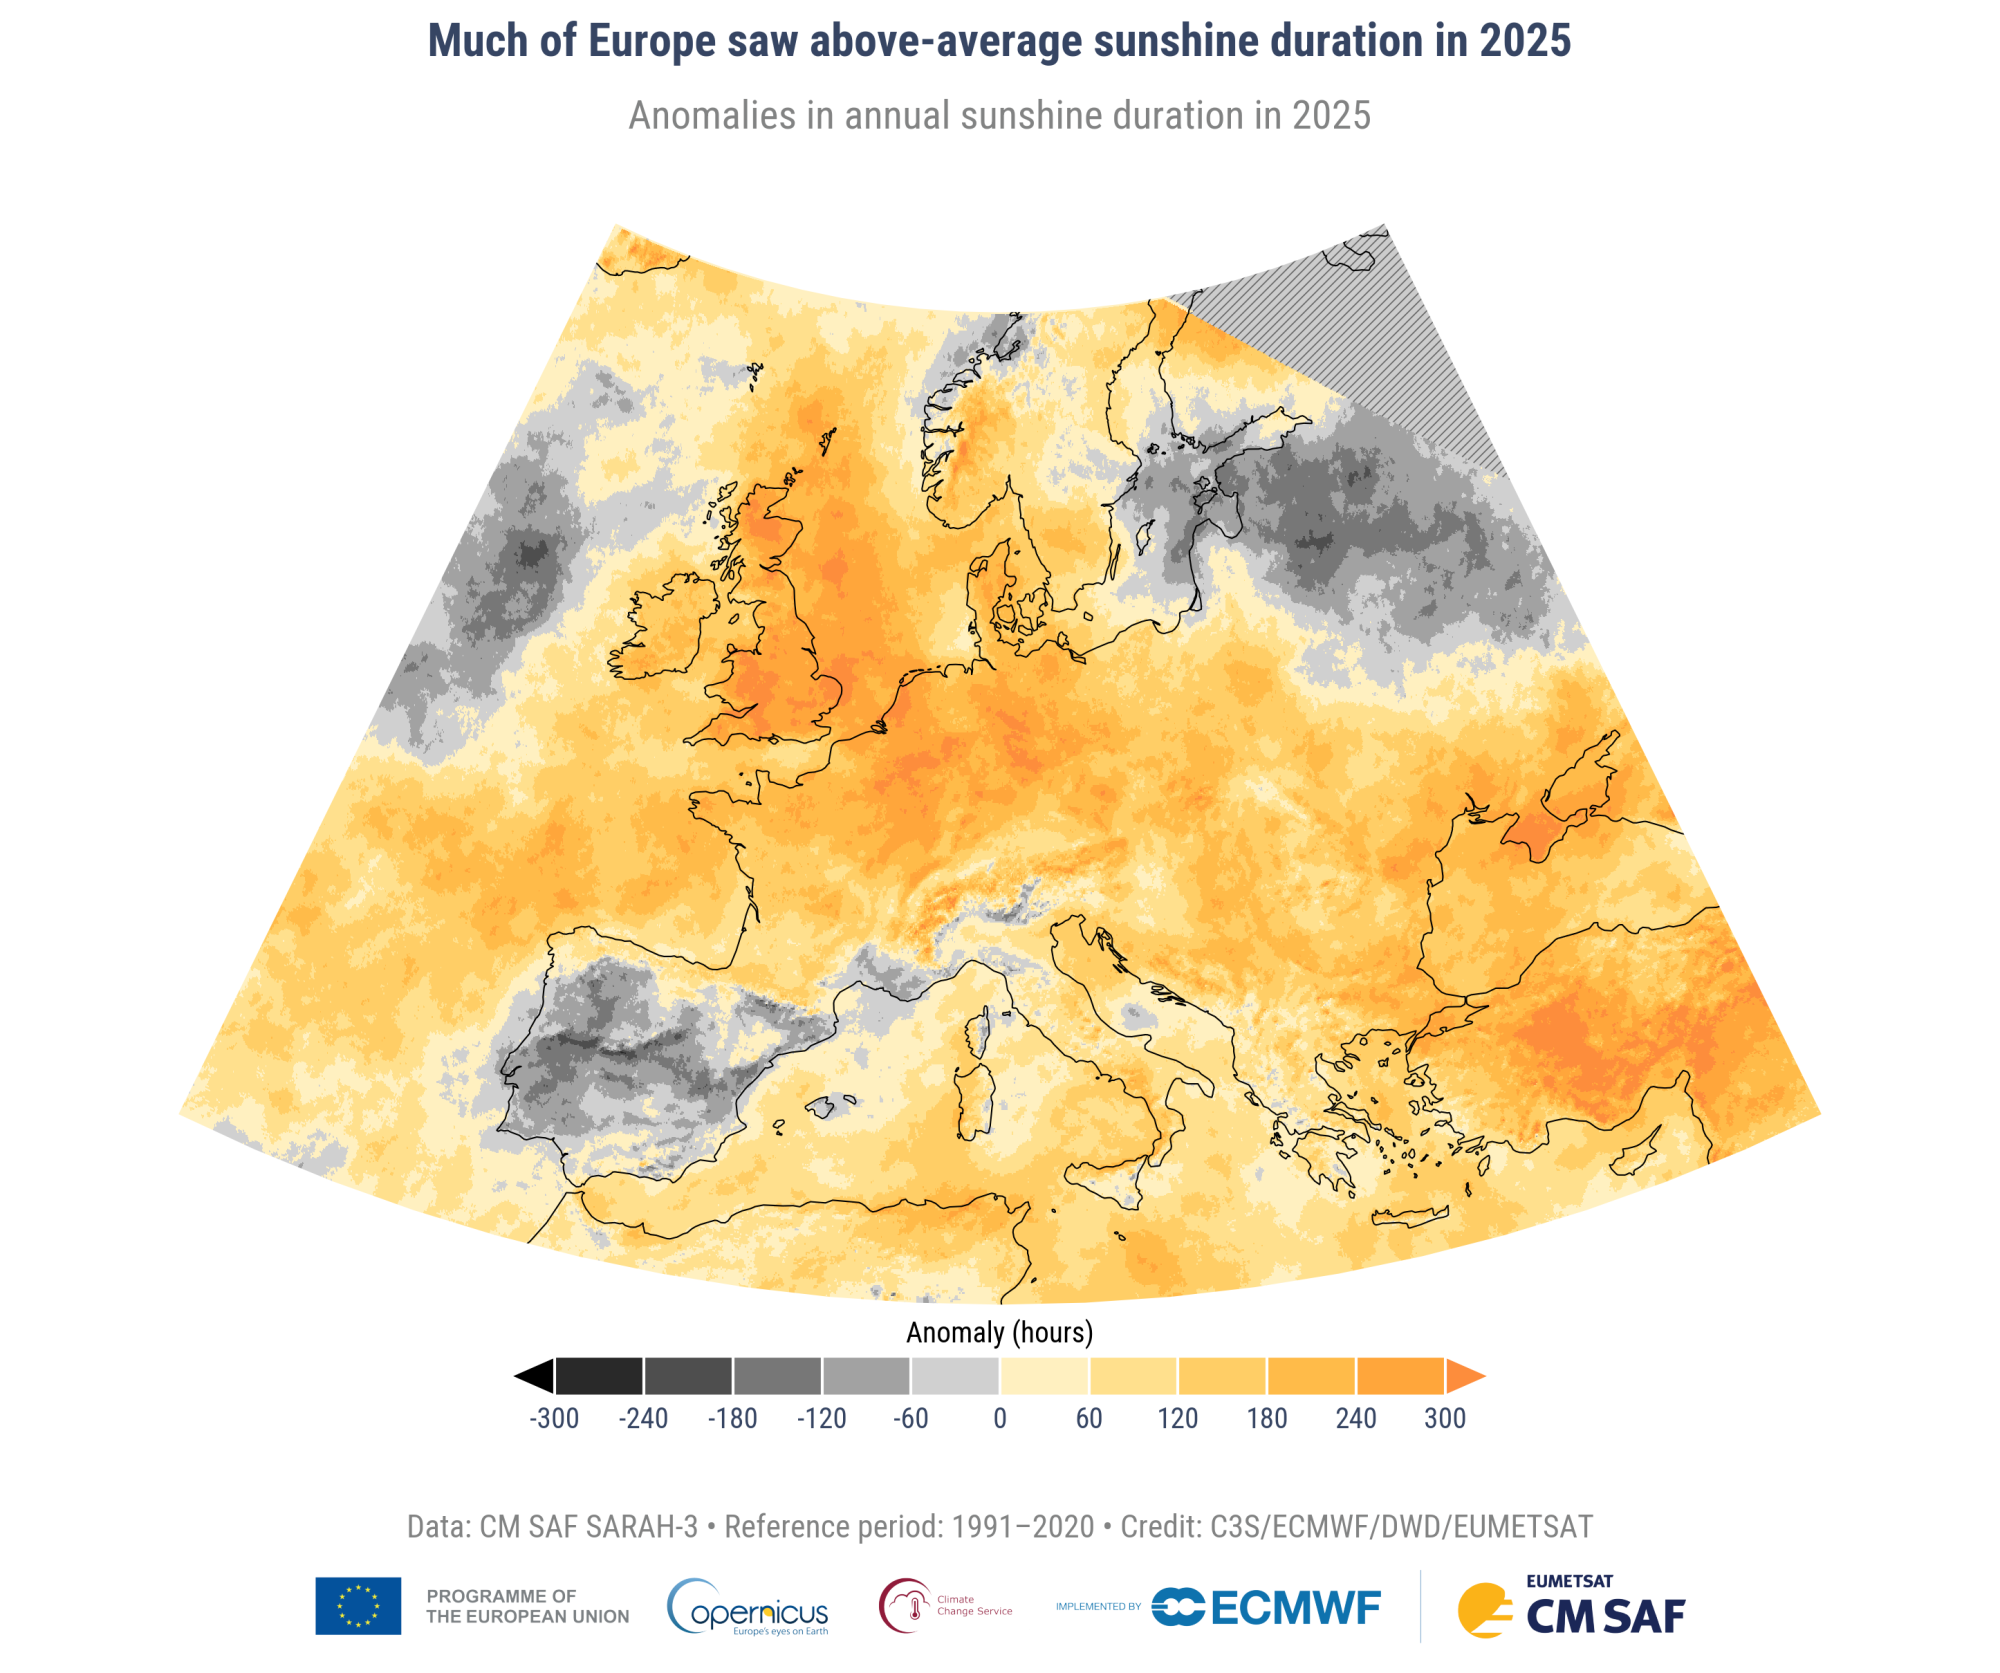
Above-average sunshine duration, but contrasting conditions
Most of Europe saw above-average sunshine duration in 2025, with the Iberian Peninsula, together with parts of the western Mediterranean, western Russia and much of the Baltic states being the exception. Overall, there is an increasing trend in solar radiation and a decreasing trend in cloud cover for Europe.