A different modeling approach fills large gaps in the U.S. government’s flood risk estimates, revealing previously overlooked at-risk areas often surrounding small flood-prone streams.
By Oliver Wing, Paul Bates, Christopher Sampson, Andrew Smith, Joseph Fargione, and Kris Johnson
Over the past week, the United States saw floodwaters rise near the coast of North Carolina in the aftermath of Hurricane Florence. Swollen rivers have effectively cut off Wilmington, a city of some 119,000 residents, and residents in surrounding regions are being ordered to evacuate as rivers continue to rise and test the strength of dams. Thus far, the storm has claimed 36 lives.
The cost in lives and property damage from Florence will take years to assess; initial estimates suggest that Florence’s damage could reach $30 billion. Add this to last year’s triumvirate of devastating U.S. hurricanes—Harvey, Irma, and Maria—which saw a combined death toll of 3,100 and damages estimated to be $275 billion. Not surprisingly given these events, decision-makers and the American public are focusing on issues related to flooding from hurricanes and other sources.
To mitigate potential losses from floods yet to come, we first need an idea of where these damaging floods can occur. In the United States, this information is provided by the Federal Emergency Management Agency (FEMA), which produces maps of flood zones to help enforce regulations under the National Flood Insurance Program.
The approach FEMA takes involves developing separate hydraulic models for individual river reaches and then stitching the model outputs together to generate a nationwide view. This traditional “bottom-up” approach is the gold standard in flood inundation modeling.
But although the approach allows important local details to be captured, it also requires significant resources and time to accomplish. Also, there is no efficient way to rerun a given simulation to incorporate new data or test new scenarios. As a result, FEMA mapping currently covers only about 60% of the conterminous United States (CONUS), and the maps may not represent headwater areas and smaller floodplains.
You may ask, Surely there’s a better way to evaluate flood risks? The short answer is yes. It involves a “top-down” approach, harnessing big data to automatically create flood inundation models from local to global scales.
A new approach to calculating the 100-year floodplain
Over the past 5 years, researchers across the globe have started to develop a set of these alternative top-down approaches to flood inundation modeling over vast areas, taking advantage of increasingly available large data sets and high-performance computing resources. These methods take available digital elevation models (DEMs), river hydrography, and gauging station data and use them to automatically create flood inundation models of whole regions, countries, or even the world.
Such approaches do not currently outperform local bespoke modeling, but many flood management questions can be answered only by consistent flood maps with the type of complete coverage that these top-down methods produce. For many flood management questions, it may also be acceptable to sacrifice a small amount of local accuracy to achieve a national-scale view.
We recently conducted a study [Wing et al., 2018] to quantify the number of people exposed to flooding in the CONUS using just such a top-down approach. Our team spanned both sides of the Atlantic, from the University of Bristol and Fathom (a flood analytics company) in the United Kingdom and The Nature Conservancy and the Environmental Protection Agency in the United States.
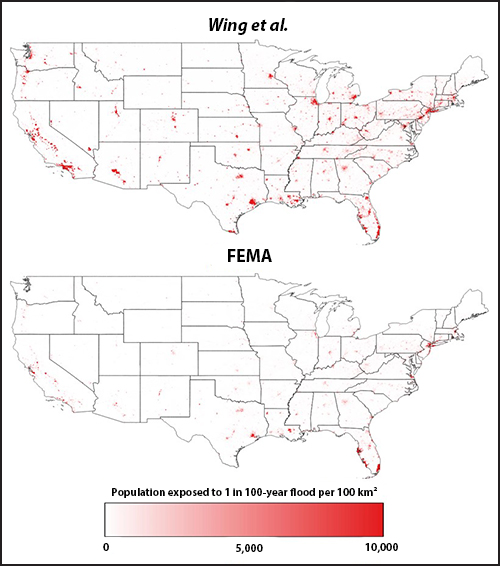
Fig. 1. (top) A large-scale modeling approach [Wing et al., 2018] estimates the nationwide distribution of people exposed to a 1-in-100-year flood to be about 3 times the estimate arrived at by (bottom) a local FEMA model approach.
The regulatory flood zone mapped by FEMA captures the areas of land that have a 1% or greater chance of being inundated in any given year, or to put it another way, areas that would be expected to experience at least one flood every 100 years. Using bottom-up approaches to calculating population exposure (i.e., within these FEMA flood zones), we estimated that 13 million people are at risk of this so-called 100-year flood (Figure 1).
Our transatlantic team performed the same calculation with an automated, large-scale hydraulic model covering the entire CONUS at ~30-meter resolution [Wing et al., 2017]. We found that almost 41 million people—more than 3 times the FEMA estimate—are exposed to the possibility of a 100-year flood [Wing et al., 2017; Smith et al., 2015; Sampson et al., 2015].
Comparing the flood maps
Both flood maps are the output of hydraulic models that in their simplest sense receive input in the form of an extreme river flow. The models then work out how this translates to flood extent on the ground.
Two key pieces of information are required: the magnitude of the extreme river flow and the elevation of the adjacent land. The input to both models, the 1-in-100-year maximum discharge for a particular stretch of river, is calculated on the basis of historic annual river gauge records. The lay of the land is determined by a DEM. The quality of DEMs varies across the United States; the majority of densely populated areas are covered by highly accurate airborne laser scanning (lidar) data, with correspondingly sparser coverage in less populated areas.

Fig. 2. A typical snapshot of the flood maps produced by each model approach for an area of Illinois demonstrates FEMA’s tendency to focus on larger rivers, missing the flood risk associated with smaller streams. Our modeling method, on the other hand, captures a finer level of detail.
Thus, although both FEMA’s bottom-up approach and our top-down approach use the same input, the two methods produce different estimates of exposed populations. Examining the simulation results obtained using both approaches highlights why the discrepancy in flood-exposed population estimates arises. Unlike the FEMA map, our map is able to estimate flood hazard in all basins down to just a few square kilometers in area, thus capturing the risk posed by smaller streams (Figure 2).
How does our top-down approach achieve a higher precision than FEMA’s bottom-up approach? Our approach’s ability to represent smaller streams is not by virtue of obtaining better or more localized data. Rather, our spatially consistent, automated, and efficient model-building process, coupled with our computational capacity, can produce flood maps in every river basin. In contrast, FEMA’s highly detailed approaches take skilled operators several months to perform for river reaches a few tens of kilometers in length, and this is why spatial coverage is relatively low. FEMA engineers triage the larger streams in a catchment, often to the detriment of the headwaters, whereas our approach captures conditions in the headwater areas as well.

Fig. 3. A map comparing our large-scale model with FEMA’s model for an area of Alabama. The two approaches produce similar results here, where the FEMA data exist, with our large-scale floodplain model capturing more than 90% of the FEMA floodplain with minimal genuine overprediction. From Wing et al. [2017].
The caveat here is that our approach sacrifices some local accuracy to achieve this broad view of flood hazard across the CONUS. In areas where FEMA models do contain detailed surveys of flow-controlling structures (e.g., levees, culverts, dikes, bridges), these models will likely supersede the large-scale alternative. However, a study that performed a point-by-point comparison between the FEMA model and large-scale models suggests that where FEMA maps exist, the two approaches often produce similar results (Figure 3).
Compared to high-quality FEMA flood maps, the large-scale model captured 86% of the specified floodplain [Wing et al., 2017]. The correspondence was even better on larger rivers, in temperate climates, and in more rural basins. This top-down model therefore fills in the areas that the bottom-up FEMA maps miss, such as areas around small streams and across broad swaths of the midwestern and northwestern United States.
We find that this data gap equates to an extra 28 million Americans living in the 100-year flood zone. This difference is so large that even amid likely model uncertainties, it is a significant result.
Implications for flood risk management in the United States
Scientists and policy makers require comprehensive floodplain mapping to manage U.S. flood risk in a coordinated way. Accurate, engineering-grade flood models in every river basin in the CONUS would be ideal, but given realistic financial constraints, it is clear that we need new, affordable approaches to generating comprehensive national maps.
An understanding of flood risk across the nation, rather than in patches, could lead to fewer surprises akin to Hurricanes Harvey in Texas and Irma in Florida. Such a comprehensive understanding could also assist opponents of continued development in risky areas and ensure that the culture of preparedness FEMA wishes to build becomes a reality across the country.
In addition, a large-scale modeling approach can answer a number of crucial questions that cannot be addressed by a patchwork of local models. Because nationwide flood maps can be produced quickly and relatively cheaply, a wealth of new products could be generated. For example, in addition to the 100-year floodplain, other return periods can be mapped, which enables improved risk management through a graded system. With this information, community authorities could perhaps seek to impose more stringent regulations on buildings in the 1-in-20-year floodplain while relaxing those in the 1-in-500-year floodplain.
This nuanced approach could also lead to more realistic risk assessments and flood preparation measures. Right now, risk zones in maps are treated as binary, which can be problematic: People who live just outside the currently mapped 100-year flood boundary do not face considerably less risk than people who live just within it. Yet new development tends to cluster around these boundaries, often still in risky areas. Maps that contour risks in a more detailed way could prevent this effect through ensuring a smoother gradient of development increase as you move farther outside of the higher risk zones.
Large-scale and automated modeling approaches offer flexibility as well: The ability to rerun multiple flood maps allows modelers to test the effect of different scenarios by perturbing inputsto the model. For example, the effects of climate change, population growth, land use change, and flood risk management scenarios can be included for making decisions on a national scale.
Large-scale models won’t completely replace the bottom-up approach: Certain decisions can only be made using accurate local modeling techniques. There is unambiguous value to engineering-grade local models. Such models are needed, for example, when exploring the effect of installing or removing levees. Highly localized decisions will still require a FEMA-style analysis.
What next for hydraulic modelers?
Flood inundation models, two types of which are outlined here, are subject to fundamental constraints with regard to their accuracy. The performance of FEMA-style models is approaching a ceiling: The characterization of extreme flows often imposes a fundamental limit on further model improvements. Errors of 25% or more are common in gauge observations [Di Baldassarre and Montanari, 2009], and there are gaps in the data required for the statistical analysis used to calculate flow return periods [Smith et al., 2015].
For modeling results to be meaningful, any improvements in calculations must be accompanied by commensurate improvements in the measured data and other factors in the modeling approach. For instance, there is little value to a centimeter-scale hydraulic model if you don’t actually know how big the 100-year flow is.
This need for better data, coupled with the need for many more decades or even centuries of river flow observations and an expanded river gauge network, means that the flow characterization gap is not likely to be resolved any time soon.
There is, however, still plenty of room for improvement in large-scale modeling. For example, scientists have yet to generate seamless, hyperresolution DEMs of entire continents, and the remote detection of local-scale, hydraulically important features is not yet feasible. With solutions to these problems on the horizon, it may not be long before large-scale models, too, hit the ceiling imposed by extreme flow characterization.
Despite these limitations, scientists assessing flood risk could expand and deepen their insights using a multimodel approach similar to the approach that climate scientists use. Also, on an international scale, the next big step is to run flood models with data from the high-accuracy DEM of the world. Creating a high-resolution global flood hazard model [Sampson et al., 2015] could help identify at-risk populations in areas like Africa, South America, and Southeast Asia that don’t have FEMA-style local flood maps.
Floods of data can help address flood risk
Without freely available data, we could not have conducted our assessments, which means that we could not have identified that millions of Americans face flood risks beyond those charted in FEMA maps. One thing, then, is clear: To help protect people from floods, we will continue to need a deluge of data.
Ultimately, better predictions also require better data, which is why it’s so important that the United States continues to fund U.S. Geological Survey (USGS) efforts to maintain river gauges and expand lidar data coverage to areas in the United States that lack this coverage. And it is equally important that the USGS continue to make these data public.