
Climate change exposes hundreds of millions to longer and deadlier pre-monsoon heat in South Asia
From mid April and advancing into May, India and Pakistan experienced extremely high temperatures, including daily maximum temperatures above 46°C in many cities in India ( Times of India, 2026 ).
This ongoing period of extreme heat brought severe human and economic impacts across India and Pakistan ( Al Jazeera, 2026 ), two of the most densely populated regions in the world, exposing hundreds of millions of people to dangerous conditions. At least 37 heat-related deaths were reported in India ( The Wire, 2026 ), while ten deaths were recorded in Karachi, Pakistan ( Tribune, 2026 ). The event also drove record-high electricity demand across India as cooling needs surged ( The Wire, 2026 ), while agricultural drought conditions affected over 1mio km² ( GDACS, 2026 ), compounding risks to food production and livelihoods. Beyond these direct impacts, the heat coincided with major election periods in the region, raising concerns about voter safety, campaign disruptions, and broader pressures on public infrastructure and health systems ( The Times of India, 2026 ) while potentially taking attention away from the acute dangers of heat.
According to the IPCC AR6, based on many studies, there is a well-established and robust link between anthropogenic climate change and the increasing frequency, intensity, and duration of extreme heat events in South Asia, making such episodes significantly more likely in today’s warmer climate ( Seneviratne et al., 2021 ). With World Weather Attribution, we have also undertaken several attribution studies on extreme heat events in India and South Asia, including May 2024 , April 2023 , March to May 2022 and May 2016 when temperatures of over 50°C were reached in Phalodi, Rajasthan. While the more recent studies have shown a strong increase in likelihood and intensity of extreme dry and humid heat in the region, the 2016 study did show smaller increases. The study, published in a peer-reviewed journal ( van Oldenborgh et al., 2018 ) concluded that “for the next decades we expect the trend due to global warming to continue but the surface cooling effect of aerosols to diminish as air quality controls are implemented”. A decade on, we perform a super-rapid attribution study that updates the 2022 attribution analysis, as this year’s heatwave affected broadly similar regions and reached a comparable spatial extent. We also examine how the likelihood and intensity of an event such as this one have changed in today’s climate as compared with the 2016 climate conditions, when a similarly severe heat event occurred in the region, against a backdrop of ENSO and widespread drought.
 Long Description
Key Messages
- While both India and Pakistan have invested in Heat Action Plans (HAPs) that do prevent deaths, but can lack context specific implementation guidelines and thus extreme heat continues to cause deaths and disproportionately exposes deep social inequalities. Outdoor workers, people living in poor-quality housing, and those dependent on daily wages are significantly more vulnerable to heat-related illness and mortality. In addition, since heatwaves are not a notified/ declared disaster in India and Pakistan, they are often ineligible for disaster relief funding.
- When analysing gridded observational-data products, we find that in today’s climate this event is no longer rare, with a return period of approximately 5 years. In other words, there is a 20% chance in any given April of experiencing temperatures comparable to the hottest 15-day period observed in April 2026. This contrasts with the 2022 event, which was considerably rarer because it was a longer event that occurred earlier in the season with comparatively more extreme temperatures.
- To increase the amount of data available and better assess the role of climate change in the observed changes, we combined observational records with simulations from 19 climate models that passed model validation. Our analysis concludes that human-caused climate change made this 15-day heatwave both hotter and significantly more likely. In particular, climate change approximately tripled the probability of an event like the 2026 heatwave. The same event would have been about 1°C cooler in a preindustrial climate.
- It is important to highlight that the increase in both the likelihood and intensity of extreme temperatures in April is much greater than in May. This means that people in India, Pakistan, and across South Asia are now facing a much longer period of extreme heat, with the risk of intense dry heat in the earlier months compounded by humid heat during the pre-monsoon period, as a result of human-induced climate change. This brings severe consequences for health, agriculture, and the economy, even before the monsoon begins.
- We also combine climate models and observation-based products in the same way to study changes in only the past 10 years, during which time the world has warmed by approximately 0.4°C. In this short time, we find an increase in intensity of such heat events by 0.3°C and an increase in likelihood of about 35%.
- With future warming, climate models project that such an event will become substantially more likely and intense compared to present day, indicating that periods like late April 2026 will quickly become a cool pre-monsoon season. Given an additional 1.3°C of warming, such events will become more than twice as likely again and another 1.2°C hotter.
- We also analysed changes in the single hottest day in April with observations only. We found that the hottest April day in 2026 over the study region was again approximately a 1 in 5 year event. The results of the trend analysis are also very similar to the 15-day analysis, with similar events now about 20 times more likely and about 1°C hotter. This result was also stronger than analysis of the hottest day in both April and May each year, suggesting that such hot days are occurring earlier.
- These changes in the temperature of heatwaves are lower than for many other regions of the world. This is likely due to the combined effect of atmospheric aerosols and increased irrigation of the land surface in recent years, partially offsetting warming due to greenhouse gases. However, a concurrent rise in relative humidity due in part to these same drivers means that dangerous humid heat is still rapidly rising in the region, in line with the findings of several other attribution and climate analyses.
- India has invested in heat action plans and built an increasingly comprehensive heat-response system, focussing on emergency management. Considering the increasingly dangerous temperatures a focus on proactive adaptation planning on long-term climate resilience and urban retrofitting and redesign are needed, in addition to emergency response.
Overview of heatwaves in India and Pakistan
As set out briefly above, there is a well-established and robust link between anthropogenic climate change and the increasing frequency, intensity, and duration of extreme heat events in South Asia, making such episodes significantly more likely in today’s warmer climate ( Seneviratne et al., 2021 ). Several World Weather Attribution studies have assessed the anthropogenic influence on specific hot events in the pre-monsoon season in recent years, including: March-April mean daily maximum temperatures in 2022 over a region covering northwestern India and Pakistan, which were found to be approximately 30 times more likely and 1°C hotter ( Zachariah et al., 2022 ; Zachariah et al., 2023 ), which was found to be robust to different treatments of natural variability ( Nath et al., 2024 ); 4-day humid heat in April 2023 over a region covering most of coastal and eastern India and Bangladesh, which was found to have been made more than 30 times as likely and about 2°C hotter (in ‘Heat Index’; Zachariah et al., 2023 ); mean April temperatures in 2024 in a large region stretching from India to Vietnam based on observation-based data were found to be about 45 times as likely and 0.85ºC hotter ( Zachariah et al., 2024 ).
This work is in line with the wider literature on changes and projections in extreme heat in the region, with an observed increase in duration, frequency and severity of heatwaves across most regions of India ( Gupta et al., 2025 ; Rohini et al., 2016 ), which can be attributed to anthropogenic forcings including emissions and land use change ( Kishore et al., 2022 ), as well as clear increases in both maximum and minimum temperatures in Pakistan ( Khan et al., 2019 ). These trends are observed in spite of sources of cooling in the region, including widespread irrigation and relatively high atmospheric aerosol concentrations, especially over western India ( Ajay et al., 2023 ; van Oldenborgh et al., 2018 ). However, while such anthropogenic factors may partially counter the warming influence of greenhouse gases, they also lead to a net increase in surface relative humidity, which can in turn amplify net heat stress ( Ajay et al., 2023 ; van Oldenborgh et al., 2018 ). Projections using a variety of climate models also find further increases in heatwave frequency and intensity with further global warming, as well as earlier onset and delayed cessation due to more persistent geopotential height anomalies ( Jayasankar et al., 2026 ), and often due to both amplified temperature and humidity conditions ( Molina et al., 2026 ). Future increases in extreme heat are also projected for Pakistan using high resolution regional climate models ( Saeed et al., 2017 ).
Analysis of trends in extremes: Event definition
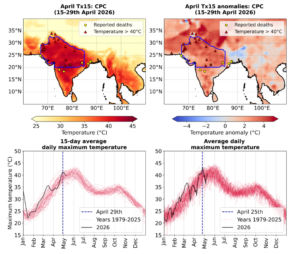
The 2026 spring season in northwestern India and Pakistan is characterised by distinct sequences of hot extremes, with the earliest hot spell reported in February and continuing into March. This was followed by a cooler interval associated with western disturbances, culminating in the recent, more intense heat episode since mid-April. The top left panel in Figure 1 shows this event, with several locations witnessing temperatures over 40°C and also cases of heat-related deaths.
In order to capture the impact from this relatively early episode of intense heat, in this short analysis we examine trends in both maximum 1-day and 15-day averaged daily maximum temperatures in April, over a region spanning Pakistan and northwestern India (Fig. 1), henceforth Tx1x and Tx15x, respectively. This region corresponds with the highest anomalies observed during this period (top right panel, Fig. 1) and was previously used in a rapid attribution study for the extreme heat in March-April 2022 ( Zachariah et al., 2022 ; Zachariah et al., 2023 ), allowing direct comparison and reference to those results as set out above. We further examine the same indices for the months of April and May combined, to test the sensitivity in our results and explore how hot season events are changing more broadly (shown in Appendix).
The methods used to analyse heat trends follow the standard WWA protocol using non-stationary extreme value theory, as described in Philip et al. 2020 and expanded upon in Otto et al., 2024 . Specifically, the extremes indices Tx1x and Tx15x are modelled using a generalised extreme value (GEV) distribution that is assumed to shift with global mean surface temperature. A more detailed description of this method and an example can be found in Clarke et al., 2026 . In this study we conduct an observation-only analysis for Tx1x and combine observation-based gridded products and climate models for Tx15x (data described in the Appendix). In line with the protocol described in Philip et al. 2020 , climate models are evaluated in their representation of observed weather and climate characteristics of the region.
[...]