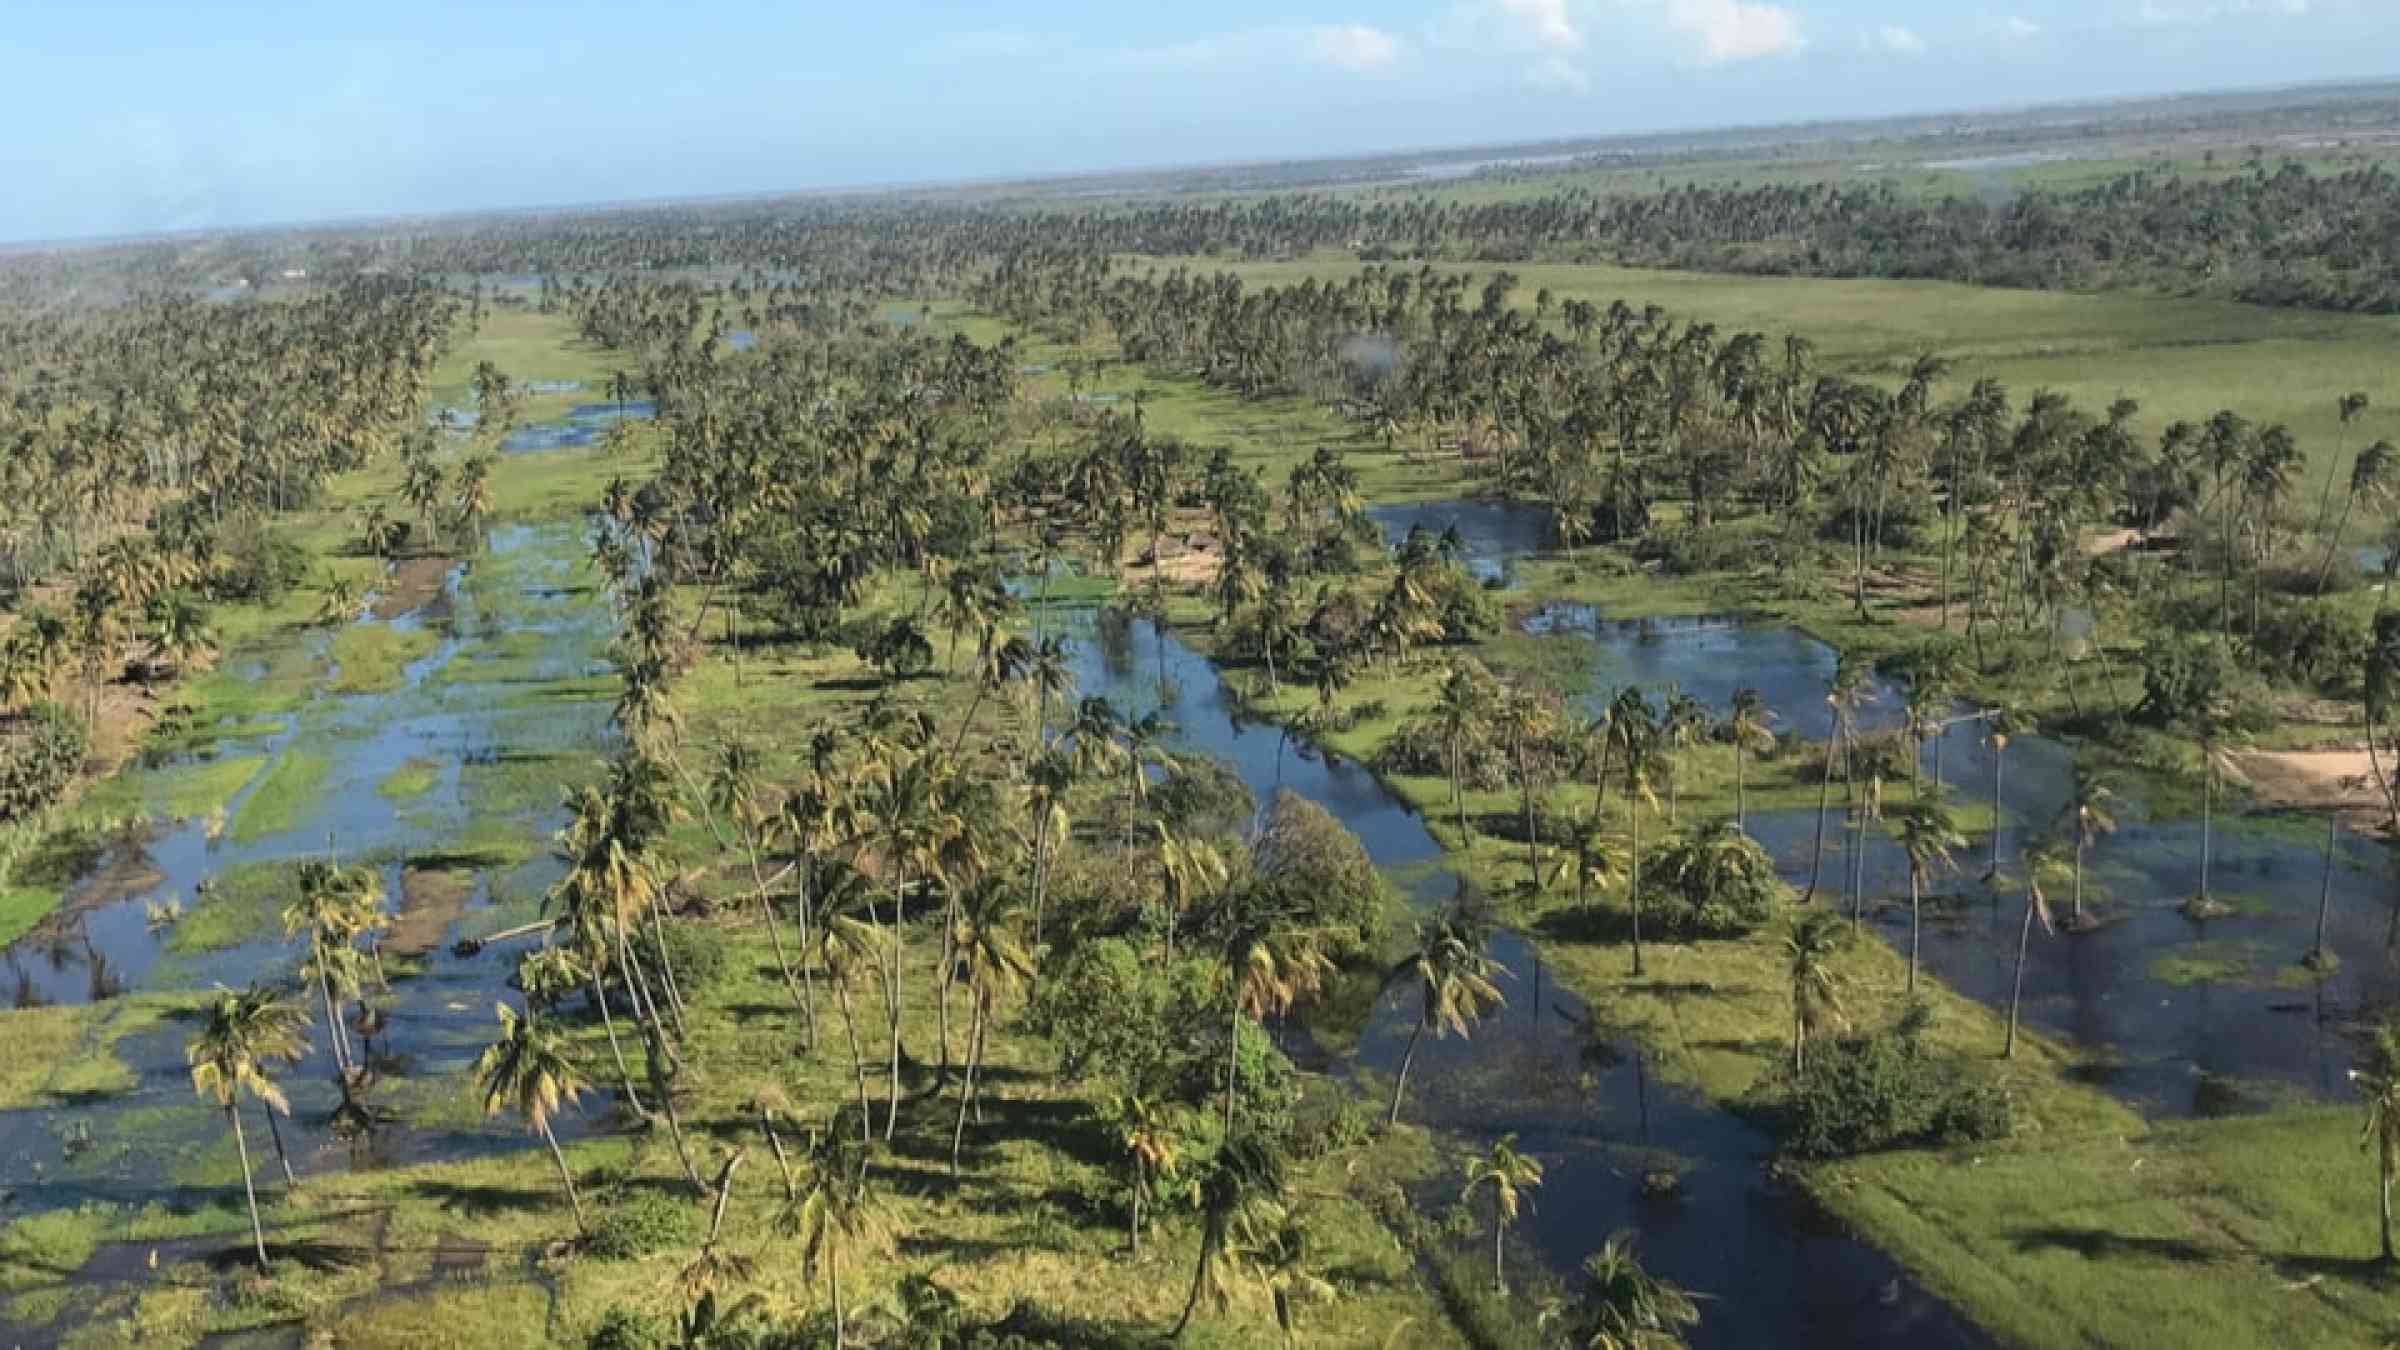
Cyclone, hurricanes and typhoons
A tropical cyclone is a cyclone of tropical origin of small diameter (some hundreds of kilometres) with a minimum surface pressure in some cases of less than 900 hPa, very violent winds and torrential rain; sometimes accompanied by thunderstorms. It usually contains a central region, knows as the ‘eye’ of the storm, with a diameter of the order of some tens of kilometres, and with light winds and a more of less lightly clouded sky (WMO, 2017).
Hurricanes, tropical cyclones and typhoons affect millions every year, and are likely to become more severe in the future although possibly less frequent due to global warming.
Tropical cyclones, hurricanes and typhoons, although named differently, describe the same hazard type. They are referred to as tropical cyclones in the Indian Ocean and South Pacific, hurricanes in the Atlantic and eastern North Pacific, and typhoons in the western North Pacific. In the north Atlantic and the Caribbean, August and September are usually peak months of the hurricane season, which spans from June through to November. In the eastern North Pacific, the season starts in mid-May and finishes in November. The North Indian Ocean cyclone season is between April and December, with peaks in May and October.
Tropical cyclones are often difficult to predict, because they can suddenly weaken or change their course. However, meteorologists use state-of-art technologies and develop modern techniques such as numerical weather prediction models to predict how a tropical cyclone evolves, including its movement and change of intensity, when and where one will hit land and at what speed. Official warnings are then issued by the National Meteorological Services of the countries concerned (WMO).
This hazard category also includes cyclone-related Storm surges which is the rise in seawater level caused solely by a storm. It is the abnormal rise in seawater level during a storm, measures as the height of the water above the normal predicted astronomical tide. The surge is caused primarily by a storm's winds pushing water onshore.
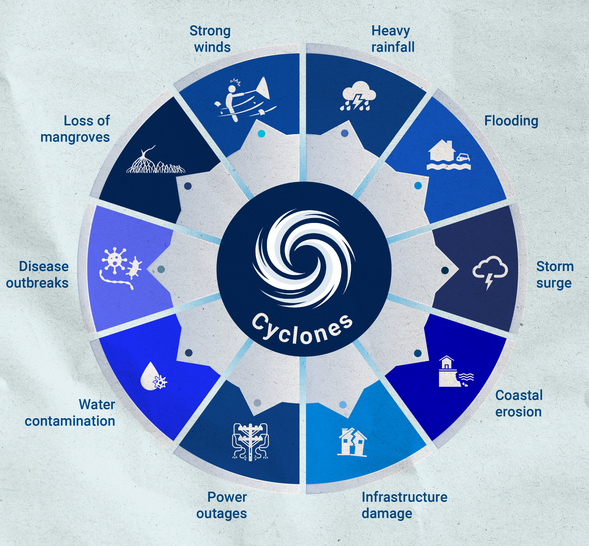
Enlarge image >
Risk factors
- Climate change: Due to warmer global temperatures, the proportion of high-intensity cyclones has increased. Also, cyclones are likely to move slower on land, and thus become more devastating.
- Environmental degradation: Deforestation creates a warm area that draws in sea breezes from the ocean during the daytime, producing moisture, and leading to storms. In turn, rising waters can make wastewater treatment plants, sewers, hazardous waste sites, agricultural lands and animal feeding operations overflow, carrying pollutants into waterways.
- Coastal development, including urbanization in coastal areas: Apart from increasing its exposure to coastal hazards, a city’s impervious sidewalks and streets increase, heavy rainfall can not be absorbed into the ground.
Vulnerable areas
- Coastal areas are the most cyclone-prone.
- Tropical cyclones are generally accompanied with heavy rains and severe flooding.
- Coastal areas with shallow slant bathymetry and flat plain, with storm surges that may threaten tens of thousands of people living by the sea.
- The most vulnerable populations are those who are living in poor buildings and fragile constructions in the coastal zones.
- The Small Island Developing States are also vulnerable because some might be indebted, their economies undiversified and hazard events can affect the whole territory.
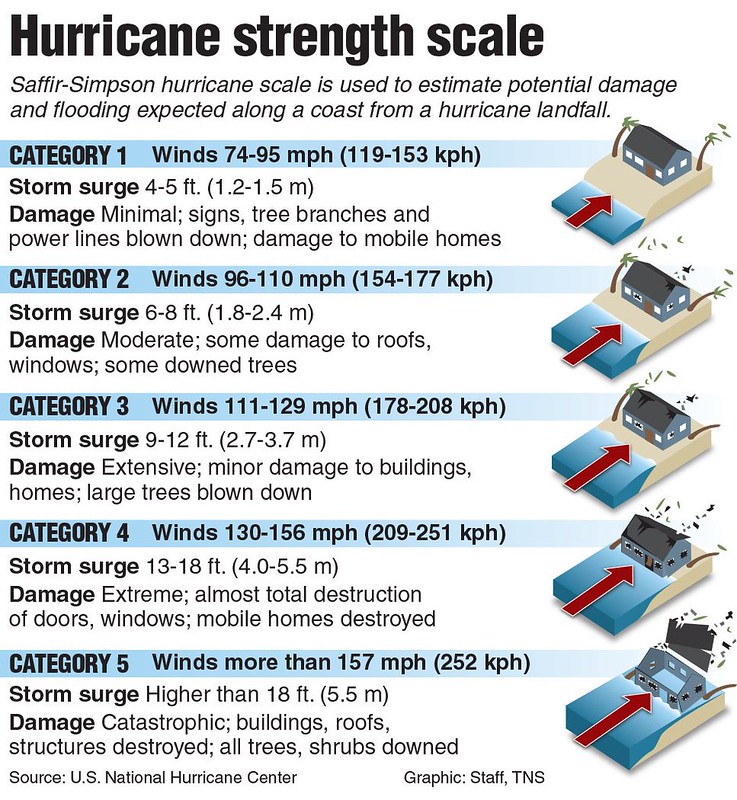
Saffir-Simpson hurricane scale
Hurricanes are ranked according to the Saffir-Simpson hurricane scale, which classifies the damage caused by hurricanes to wind speed. Hurricanes can inflict terrible damage even from their formative stage.
Risk reduction measures
- Evacuation exercises to ensure full community participation.
- Structural measures to withstand/lessen the impact of winds and flooding.
- Land use control and limiting the exposure of critical assets.
- Integrate flood risk assessment into urban planning strategies.
- Avoid building directly on the coastline.
- Maintain wind-proof buildings for community shelters.
- Use of flood-resistant material in construction.
- Grey infrastructure: sea walls revetments, protective embankments, levees and dikes.
- Natural infrastructure: mangroves, coral reefs, wetlands and forests.
- Education: information on cyclones and protection from cyclone damage in school and social activities.
- Protect and evacuate animals.