World population facing water stress could ‘double’ by 2050 as climate warms

By Daisy Dunne
The number of people exposed to water stress could double by 2050 if efforts are not made to keep global warming below 2C above pre-industrial levels and future population growth is high, a study finds.
This means an additional 380 million people could face water stress by mid-century, when compared to the number in 2010.
Even if the world does meet the Paris Agreement’s temperature target of limiting warming to below 2C and population growth is low, the number of people exposed to water stress could still rise by 50% by 2050, when compared to 2010, the research says.
Increases will be concentrated in the Middle East, North Africa and south and central Asia – regions that already face significant challenges as a result of water stress, the lead author tells Carbon Brief.
Running dry
Around two-thirds of the global population – four billion people – face water scarcity for at least one month a year in today’s world.
Water availability is affected by physical processes – such as the amount of rainfall, rate of evaporation and the geology of the land surface and human management, through dams, groundwater extraction and reservoirs.
For many countries, water availability is also shaped by the actions of other nations that lie further upstream. These shared water resources are described as “transboundary” and include, for example, major rivers that traverse multiple countries.
The new study, published in Earth’s Future, examines how climate change could shape water stress across international borders. “Water stress” is a measurement of the ratio between water use and availability, the authors say. It is specifically a measure of “demand-driven” water scarcity, they explain in their research paper:
“The focus here is on water stress – calculated as a water use-to-availability ratio – because…it captures well a simple intuition about how water use and availability relate: when water is abundant, water use generally has less impact than when water is in short supply.”
Forecasting thirst
For the research, the authors combined data from hydrological models and climate models. To make projections for water stress in 2050, they looked into two possible scenarios.
The first scenario assumes future population growth is low and efforts are successfully made to keep global warming below 2C. (This combines the climate change scenario “RCP2.6” and the shared socioeconomic pathway “SSP1”.)
The second scenario assumes future population growth is high and global emissions do not peak until 2060. (This combines the scenarios “RCP6.0” and “SSP3”.)
The research finds that, under the first scenario, the number of people facing water stress would double by 2050, when compared to 2010. This equates to an additional 380 million people facing water stress. (The total human population is estimated to be just under 10bn by 2050 in this scenario.)
However, if both global emissions and population growth are low, the number of people facing water stress is instead expected to increase by 50%.
The maps below give a global view of water stress (left) – and relative change to water stress (right) – in 2050 under the low emissions and population scenario (top) and the high emissions and population scenario (bottom).
The left-hand map displays the expected water stress ratio for different regions in 2050, with 0-0.1 indicating no stress (yellow), 0.1-0.2 indicating approaching stress (dark orange), 0.2-0.4 indicating moderate stress (orange), 0.4-0.7 indicating high stress (red) and a ratio of more than 0.7 indicating chronic stress (dark red).
The right-hand map shows relative changes in stress from 2010 to 2050, with light to dark blue indicating lower stress and light to dark orange indicating higher stress.
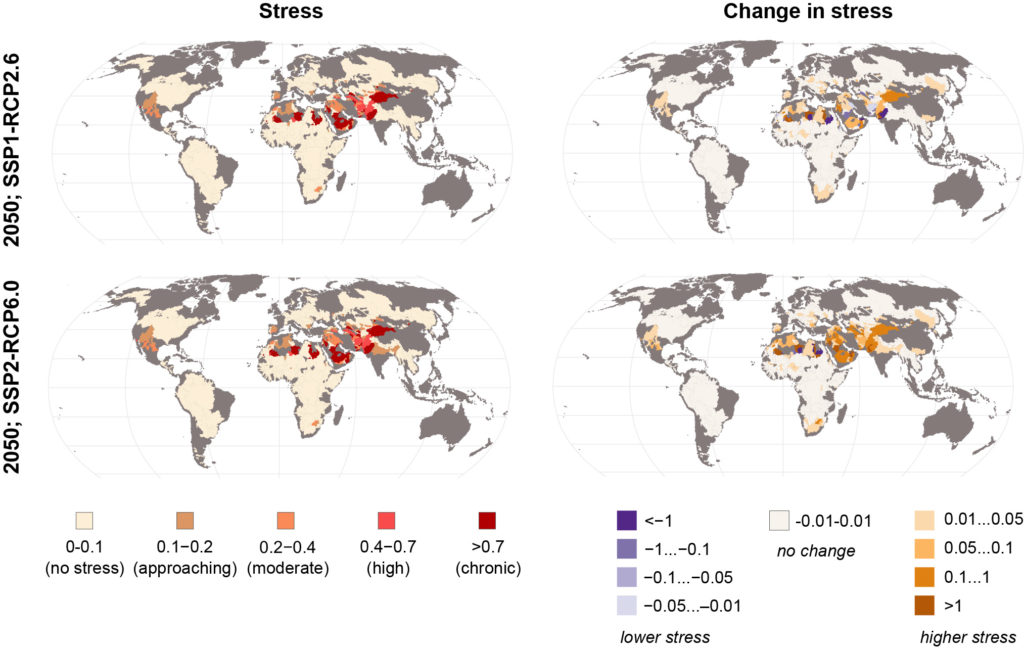
Study author, Prof Matti Kummu, a water researcher at Aalto University in Finland, tells Carbon Brief:
“There are not many new areas facing high water stress but the stressed river basins will see even higher stress levels in future. The largest increases were found to be North Africa, Middle East and south and central Asia.”
The US’s midwest region could also see moderate water stress by 2050, the study shows.
Warming influence
For the second part of the study, the authors explored the potential drivers of water stress in different world regions.
The possible drivers included changes to local water availability and consumption, as well as upstream water availability and consumption.
Changes to local water availability are driven largely by climate change, explains Prof Niko Wanders, a hydrologist from Utrecht University in the Netherlands who was not involved in the research. He tells Carbon Brief:
“Climate change can alter local precipitation patterns, but also evaporation. All the water that comes to the Earth’s surface can either go away as discharge – to rivers and streams, and eventually the ocean – or it can evaporate. Climate change can have an important role because evaporation is partly driven by solar radiation and temperature.”
Changes to local and upstream water consumption, however, are driven by human actions and population growth.
The final driver, upstream water availability, is affected by both climate change and the actions of the upstream countries, says Wanders.
For instance, climate change can affect how much water flows from a water source to countries downstream. For example, a decline in snowfall on a mountain range can reduce the availability of water from snowmelt in the lowlands in spring and summer. However, human actions, such as large-scale water extraction from rivers and dam building, can also affect how much water passes from one country to the next.
The maps below show percentage changes in local water consumption (top) and availability (bottom) in 2050 when compared to 2010 under the high emissions and population growth scenario. On the maps, blue indicates a percentage decline while red indicates a percentage increase.
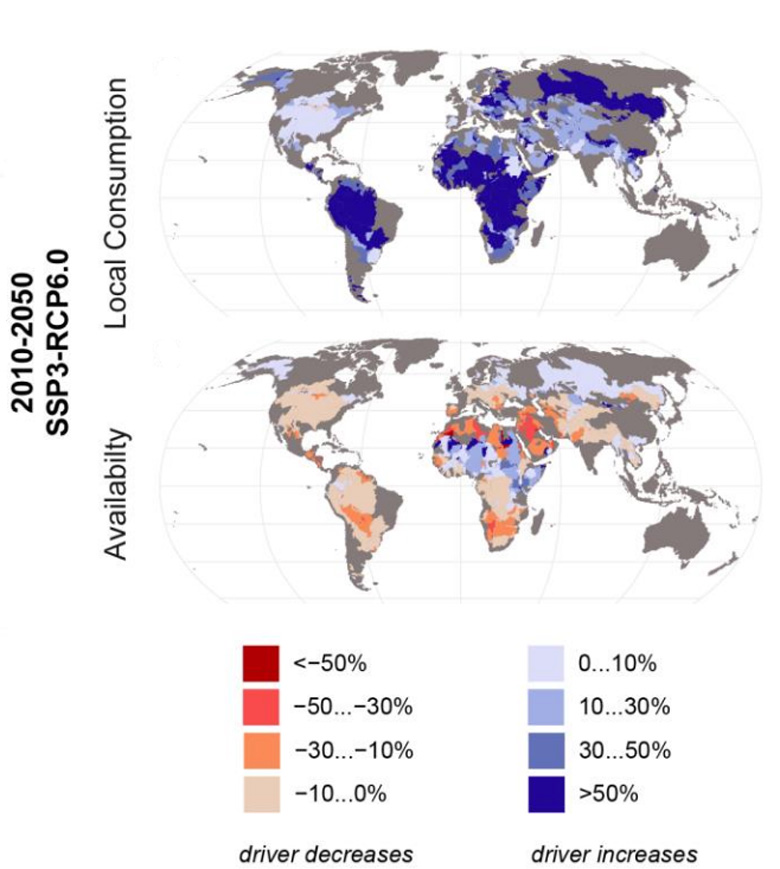
The maps show how, in the future, consumption of water is likely to increase – particularly in sub-Saharan Africa and South America – while water availability is likely to fall. The large increases in consumption are driven by population growth, according to the study.
The decline in water availability seen in the Arab Peninsula and parts of North Africa is likely influenced by climate change, says Kummu. “[With] climate change, there is little the countries can do to mitigate.”
For these countries, a key target should be to “pressure global actors to decrease emissions”, he adds.
Overall, the study is “interesting” – but it is worth bearing in mind its limitations, including that it does not consider changes to groundwater, says Wander. (Research covered by Carbon Brief found climate change is likely to significantly affect groundwater.) Wanders says:
“Another limitation is they don’t include how crops are likely to expand or contract in these regions. It’s possible that as water becomes more scarce, it will no longer be viable to grow crops in many of these regions. When crops disappear, this could have [a knock-on effect] on water scarcity.”