
Climate change exposes millions of Hajj pilgrims to deadly heat for increasingly longer parts of the year
The Hajj pilgrimage to Mecca is one of the five pillars of Islam and a lifelong dream for many Muslims. All Muslims who are physically and financially able are expected to make the pilgrimage at least once in their lives. This year, the Hajj falls in May, traditionally a safer and milder time of year than the scorching summer months of June to September, and 2 million people are expected to embark on the pilgrimage ( Al Jazeera, 2026 ). The pilgrims often undertake walking long distances on a daily basis, making it much harder under extreme heat conditions.
The timing of the Hajj is determined by the Islamic lunar calendar. Hajj takes place every year during the month of Dhu al-Hijjah, the twelfth and final month of the Islamic calendar, with the main rituals occurring between the 8th and 13th days of that month. Because the Islamic calendar is based on the moon, it is about 10–11 days shorter than the solar Gregorian calendar used in most of the world. As a result, the dates of Hajj shift earlier each year relative to the seasons. Over a cycle of roughly 33 years, Hajj moves through every season from the cooler winter months to the extreme heat of summer ( Yezli et al., 2024 ).
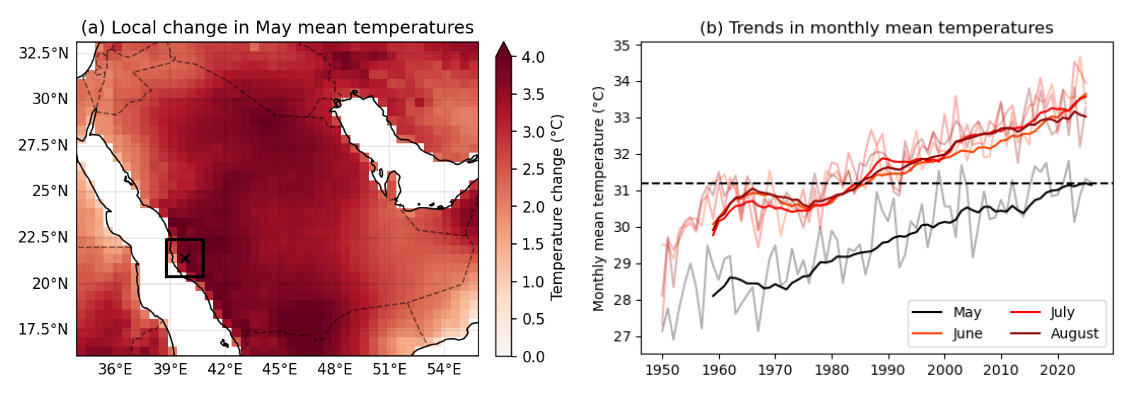
But climate change has altered those patterns. Temperatures in Saudi Arabia are rising earlier in the year and reaching more dangerous extremes, making the pilgrimage increasingly hazardous not only in the summer months, where in 2024 more than 1300 pilgrims lost their lives when Hajj started in mid-June temperatures reached 51 ° C ( The Conversation, 2024 ), but even during the spring months (Figure 1).
In a super-rapid study researchers from World Weather Attribution show that for pilgrims who spend 20–30 hours outdoors, often walking in dense crowds, the risk of heat exhaustion and heat stroke is becoming far more severe earlier in the year, with temperatures now reaching heights in May that were only seen in June to August in the 1960s and 1970s, due to human-induced climate change.
Key Messages
- Saudi Arabia’s climate has always been extremely hot, and Hajj pilgrimages that fall during the summer months have long carried risks of heat stroke and other heat-related illnesses. As temperatures rise further due to climate change, those dangers are becoming more severe. In response, Saudi authorities have introduced extensive heat action plans, including shaded walkways, cooling stations, misting systems, and expanded medical services, which have helped reduce cases of heat stroke and other heat-related illnesses among pilgrims ( Yezli et al., 2024 ).
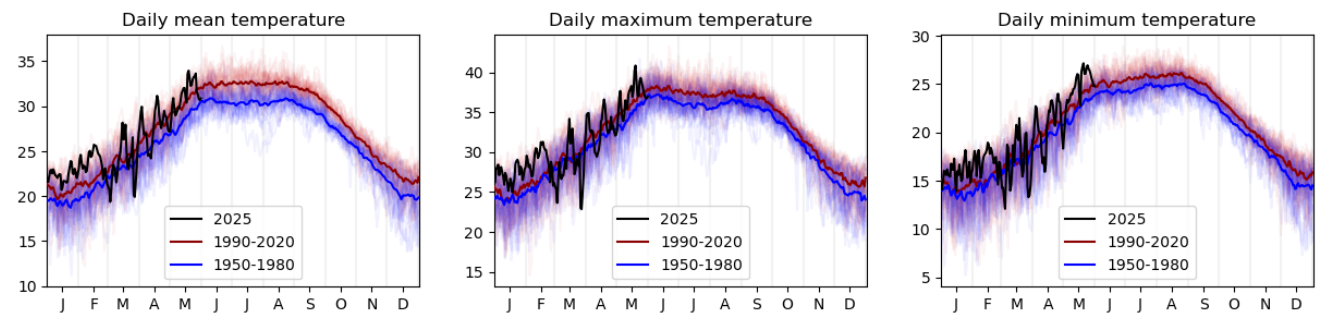
- When analysing gridded observational-data products, we find that the average daily temperatures during May 2026 are almost as high as the June-August temperatures in the period 1970 to 1990, reaching around 31.2°C in Mecca. This means what used to be a significantly cooler and thus safer time of year for Hajj is now as dangerous as the height of summer used to be.
- We find that daily maximum May temperatures of 40°C, historically more typical of the maximum temperatures seen during the peak summer months of June, July, and August, have become far more common compared with a world that was 1.3°C cooler. Such temperatures are now expected to occur in May every two to three years. Peak May temperatures are also now approximately 2°C hotter.
- We also find that average May temperatures are now approximately 3.5°C higher than would have been in a 1.3°C cooler climate. While this year’s mean May temperature of 31.2°C is fairly commonplace in today’s climate, these temperatures are now many times more likely than they would have been in a preindustrial climate. May mean temperatures above 32°C – the mean summer temperature from 1970-1990 – are now expected to occur most years, highlighting how climate change is shifting extreme heat earlier into the year.
- While Saudi authorities have implemented a range of heat mitigation measures to reduce heat-related risks during Hajj, access to these protections has not been uniform. In particular, pilgrims without official permits may face limited access to safe food, water, cooling infrastructure and medical support. Strengthening and expanding equitable access to heat protection measures will be essential to ensuring the safety of all pilgrims, especially those most vulnerable to extreme heat exposure.
- Research has shown that this trend will continue to intensify as the planet warms. One study found that if global temperatures rise by 3°C by the end of the century, roughly the trajectory current climate policies are putting the world on, around 97% of all Hajj pilgrimages would take place during periods when dangerous levels of heat are expected in Mecca. Thus, a rapid transition away from fossil fuels is essential to avoid ever more dangerous Hajj.
Known trends in heatwaves in the Arabian Peninsula
IPCC AR6 synthesises that there is medium confidence that human-induced climate change is increasing hot extremes in the Arabian Peninsula ( IPCC, 2021 ). This is a region that has experienced accelerating warming, increasing from about 0.10°C per decade during 1901–2010 ( Attada et al., 2018 ) to around 0.63°C per decade since 1978 ( Almazroui, 2020 ). Projections of annual temperatures in the region show expected increases 1.6°C under low-emissions scenarios (SSP1-2.6) and up to 5.3°C under very high emissions (SSP5-8.5) by 2070–2099, as compared to 1980-2010, with the greatest warming expected in northern areas ( Almazroui, 2020 ).
In 2024, the World Weather Attribution (WWA) initiative carried out a rapid attribution study to quantify the role of climate change in the extreme heatwave that affected large parts of Asia that year ( Zachariah et al., 2024 ). Although the study region focused on a region over Israel, Palestine, Syria, and Jordan, and lies to the north of the current study area, the nature of the trends is consistent with findings for the wider Arabian Peninsula and surrounding regions. The study concluded that human-induced climate change made such extreme heat events substantially more likely and more intense – around five times more likely and approximately 1.7°C warmer compared to pre-industrial climate.
Analysis of trends in extremes
Event definition
Warming in recent decades means that May temperatures now regularly reach levels previously more typically experienced during the summer months (Figure 2). In this short observations-only analysis we examine trends in both monthly mean temperatures and maximum 1-day temperatures during May (denoted, respectively, Tg-May and Tx1x), over the land surface within a 2-degree box centred on Mecca (39.8E, 21.4N). Due to the unavailability of long time series of station-based observations in this area, we predominantly use ERA reanalysis from 1950-2025 ( Hersbach et al., 2020 ), extended with analysis data from May 1st-25th and forecast data until the end of the month. We also consider trends in daily maximum temperatures from NOAA’s CPC dataset; this dataset only begins in 1979 and so uncertainties are typically much higher.
The methods used to analyse heat trends follow the standard WWA protocol using non-stationary extreme value theory, as described in Philip et al. 2020 and expanded upon in Otto et al., 2024 . The peak temperatures (Tx1x) are modelled using a generalised extreme value (GEV) distribution, while monthly mean temperatures (Tg-May) are modelled with a normal distribution; both indices are assumed to increase linearly with global mean surface temperature. A more detailed description of this method and an example can be found in Clarke et al., 2026 .
While we present changes in the likelihood and intensity of events with respect to the preindustrial climate (1850-1900, based on the Global Warming Index ), we note that almost all of the observed warming has occurred since 1970, meaning that events that would have been rare in a preindustrial climate would have been almost as rare during that period.
[...]