Storm Surge
A storm surge reflects the difference between the actual water level under the influence of a meteorological disturbance (storm tide) and the level which would have occurred in the absence of the meteorological disturbance (i.e., astronomical tide) (WMO, 2008, 2011, 2017).
Primary reference(s)
WMO, 2008. Technical Regulations, Volume III: Hydrology, WMO No. 49. World Meteorological Organization (WMO). Accessed 16 May 2025.
WMO, 2011. Guide to Storm Surge Forecasting, WMO No. 1076. World Meteorological Organization (WMO). Accessed 16 May 2025.
WMO, 2017. Regional Association IV – Hurricane Operational Plan for North America, Central America and the Caribbean, WMO-No. 1163. World Meteorological Organization (WMO). Accessed 16 May 2025.
Annotations
Additional scientific description
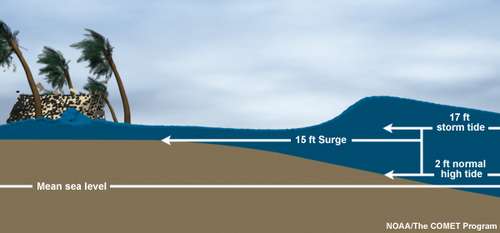
A storm surge is the rise in seawater level caused solely by a storm. It is the abnormal rise in seawater level during a storm, measured as the height of the water above the normal predicted astronomical tide. The surge is caused primarily by a storm’s winds pushing water onshore. The amplitude of the storm surge at any given location depends on the orientation of the coast- line with the storm track, the intensity, size, and speed of the storm, and the local bathymetry (NOAA, 2019a). This is illustrated in the graphic below (NOAA, 2019a).
A storm tide is the water level that results from the combination of the storm surge and the normal (astronomical) tide. A 3-metre (9.8 feet) storm surge on top of a high tide that is 2 metres (6.6 feet) above the mean sea level will produce a storm tide that is 5 metres (16.4 feet) above mean sea level. Storm surge should not be confused with storm tide. This rise in water level can cause extreme flooding in coastal areas, resulting from storm tides reaching up to 6 meters (20 feet) or more in some cases (NOAA, 2019b).
Metrics and numeric limits
Not available.
Key relevant UN convention / multilateral treaty
Sendai Framework for Disaster Risk Reduction 2015-2030.
Drivers
On top of a storm tide are pounding waves generated by the powerful winds.
Impacts
The area of seawater flooding may extend along the coast for over 100 km, with water pushing several kilometres inland if the land is low lying. The combined effects of the storm tide and surface waves can destroy buildings, wash away roads and run ships aground (Australian Government, 2020).
In 1953, for example, a storm in the North Sea resulted in a storm surge occurring simultaneously with a high spring tide. At the time, public warning systems were largely ineffective, and consequently many were underprepared. As a result, the associated flooding caused over 2500 deaths and caused substantial damage to homes, businesses, and farmlands. Following the 1953 storm surge event, the UK Government increased investments in sea defences and enhancing warning systems (Met Office, no date).
Multi-hazard context
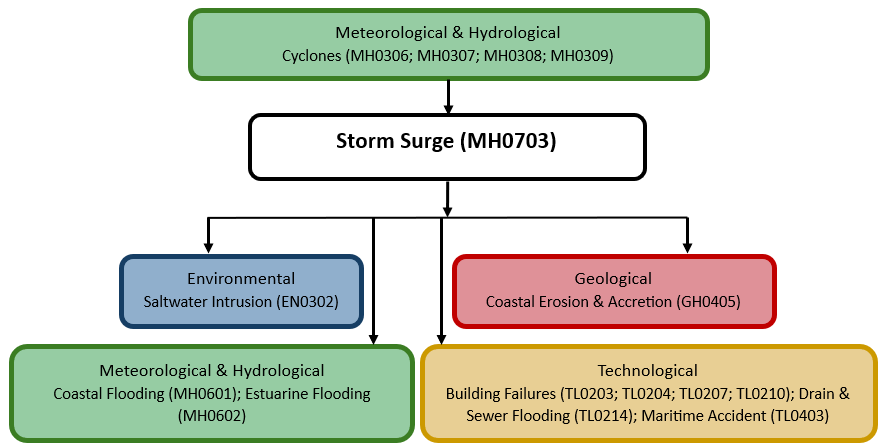
The figure below summarises common interactions between storm surges and other hazards. This information should be used with caution and not be solely relied upon in Disaster Risk Management, particularly as some interactions may not have been included. Note that hazardous events occurring together or locally in space or time may not necessarily cause, amplify, or be otherwise related to each other. Specific examples of multi-hazard context can be found in the ‘Hazard drivers’ and ‘Impacts’ sections above.
Multi-hazard diagram
Risk Management
Examples of National Alerting Parameters include storm surge warning issued in Canada (Government of Canada, 2019) and an Advisory for storm surge watch/warning issued by the World Meteorological Organization (WMO, 2017).

Monitoring
The section above and the table below offer an overview of monitoring storm surges. This information can be used for forecasting within a national early warning system (EWS). Since EWS capacities and processes differ across countries, the most current and specific information regarding EWS should be obtained from the appropriate national or regional agency/authority responsible for disaster management.
| Which institution(s) produce(s) Disaster Risk Data/Information? |
|
| How is the Hazard Observed/Monitored/Forecast? | Storm surges are monitored using tide gauges, satellite imagery, and ocean buoys to track rising sea levels and wave heights during storms. Meteorologists analyse wind speeds, atmospheric pressure, and storm intensity to predict surge behaviours. Computer models simulate how water will move inland, helping forecasters issue early warnings. These alerts help coastal communities, emergency responders, and infrastructure managers prepare for potential flooding and damage. |
References
Australian Government, 2020. Storm Surge. Bureau of Meteorology. Accessed 16 May 2025.
Government of Canada, 2019. Storm Surge: Criteria for Public Weather Alerts. Accessed 16 May 2025.
Met Office, no date. Storm surge. Accessed 16 May 2025.
NOAA, 2019a. What is storm surge? National Ocean Service, National Oceanic and Atmospheric Administration (NOAA). Accessed 16 May 2025.
NOAA, 2019b. Storm Surge Overview. National Hurricane Center and Central Pacific Hurricane Center, National Oceanic and Atmospheric Administration (NOAA). Accessed 16 May 2025.
WMO, 2017. Regional Association IV – Hurricane Operational Plan for North America, Central America and the Caribbean, WMO-No. 1163. World Meteorological Organization (WMO). Accessed 16 May 2025.