UC Irvine-led study uses social media for real-time monitoring of heat experiences in state
Machine learning-based approach can help inform targeted public health interventions.
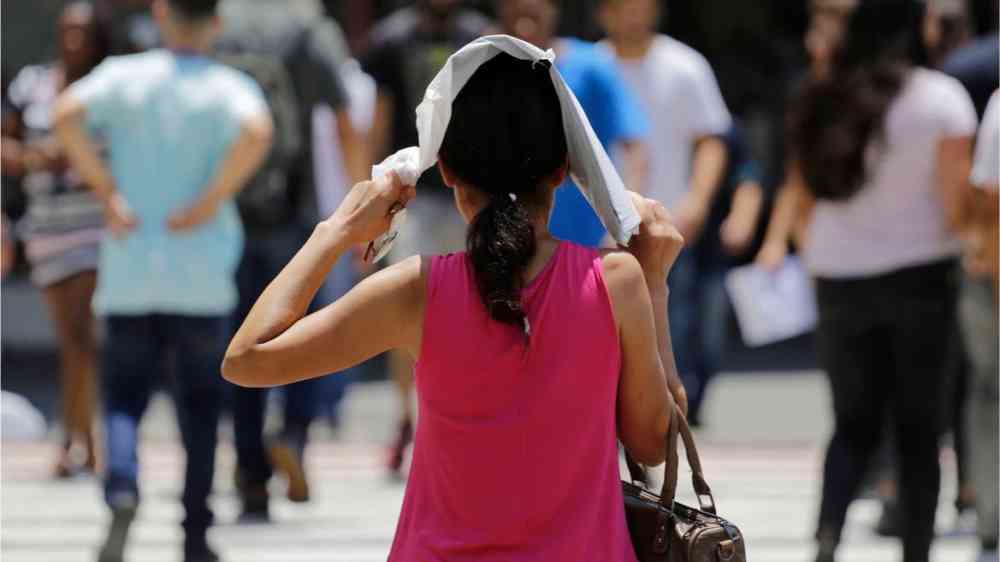
- California heat waves are becoming more frequent and intense, and not all residents have access to air conditioning.
- Researchers developed a powerful AI-based technique to identify vulnerable communities most in need of mitigation efforts, which could improve heat equity.
- The study was supported by the National Science Foundation.
A study led by health communications experts at the University of California, Irvine has yielded a new way to monitor heat equity in real time, facilitating the design of heat warning systems and targeted mitigation efforts in California’s most vulnerable communities.
Researchers at UC Irvine’s Joe C. Wen School of Population & Public Health explored online posts by Californians about extreme heat to help inform the development of targeted public health interventions. The study was supported by the National Science Foundation, and findings were published in Weather, Climate, and Society.
As California experiences more frequent and intense heat waves, not all residents are prepared to withstand them. The state’s diverse geography and population, combined with disparities in cooling access, create unique challenges in protecting public health. For example, about 20 percent of Los Angeles County households lack air conditioning, compared with less than 7 percent in Riverside County.
These differences reflect California’s varied climate zones and housing patterns: Riverside’s hotter, inland conditions have long driven greater air conditioning use, while many of Los Angeles’ older homes – particularly in coastal and lower-income neighborhoods – were built when cooling was considered unnecessary. The result is a patchwork of cooling access across microclimates, leaving some urban communities more exposed to dangerous heat.
Using a machine learning-based approach, the study analyzed over 7,000 heat-related posts on X (formerly known as Twitter) and linked them to local conditions through the Healthy Places Index – a data tool developed by the Public Health Alliance of Southern California that combines 23 social and economic indicators – and California census tract data.
“Extreme heat is an often-underestimated public health threat,” said corresponding author Suellen Hopfer, associate professor of health, society and behavior at Wen Public Health. “By integrating health equity tools like the Healthy Places Index with social media monitoring, we can better understand how Californians experience and respond to heat and identify where targeted interventions are most needed.”
The analysis found that residents in low Healthy Places Index areas, often characterized by fewer economic resources and limited access to cooling infrastructure, expressed more negative sentiments, venting and warning about the heat in their posts. In contrast, residents in high HPI areas more frequently described coping strategies and expressed relief and positive sentiments when temperatures dropped.
By combining social media analytics, including seven years of data from X, place-based health data and geospatial mapping, the researchers developed a powerful AI-based tool that could help agencies and fire departments monitor real-time conversations and existing data and respond with targeted interventions and resources in locations most affected by heat.
Additional authors included Gomathi B. Sriperumbudur and Yihang Fan, doctoral students in Hopfer’s lab at Wen Public Health; Xiaozhen Liu, doctoral student in computer science, and Chen Li, professor of computer science, at UC Irvine’s Donald Bren School of Information & Computer Sciences; and Mingyu Derek Ma, recent doctoral graduate, and Wei Wang, Leonard Kleinrock Chair Professor in Computer Science, at UCLA.