
Traditional humanitarian response plans assume single disasters-a flood, a drought, a conflict. They fail when communities face simultaneous threats from environmental degradation, climate-related hazards, armed conflict, and economic collapse. These vulnerabilities create cascading effects, demanding sophisticated analysis to assess interacting risk factors simultaneously.
Carving a Career in Crisis Mapping
It's an area of study familiar to Scholz who analyzed compound risks in Sudan for her master's thesis. Working as a graduate student intern at the Climate Centre in 2020, she used ArcGIS StoryMaps to share her conclusions in the story Compound Risk Analysis: Climate & Conflict in Sudan.
"It went viral within the Climate Centre and partners and now we have used StoryMaps as a key visualization tool in many assessments of climate and conflict," Scholz said. "Our team at the Climate Centre can put the very scientific data analysis into a visualization and a communication product that communities or the delegation can use for decision making."
Visual storytelling has become a critical tool for bridging the gap between sophisticated remote analysis and community-level action. It allows users to combine satellite-derived insights with ground-level data, images, and narrative. The tools enable field teams in places like Mali, Sudan, Timor Leste, Mozambique, and Honduras to explore complex data while understanding local context.
"Maps are the most amazing medium to convey a message, transporting the reader and communicating the conditions," Scholz said.
When Wells Run Dry: The Human Stakes Behind the Data
The human consequences of inadequate water access become clear through experiences in villages like Tin Tanzan in Mali. There, 300 herding families needed water. Women and children walked miles each day to fetch it, risking assault, improvised explosive devices, and robbery along the route. When engineers from the International Committee of the Red Cross (ICRC) arrived in October 2022 to drill a borehole, initial geological surveys looked promising.
They drilled deep but found nothing.
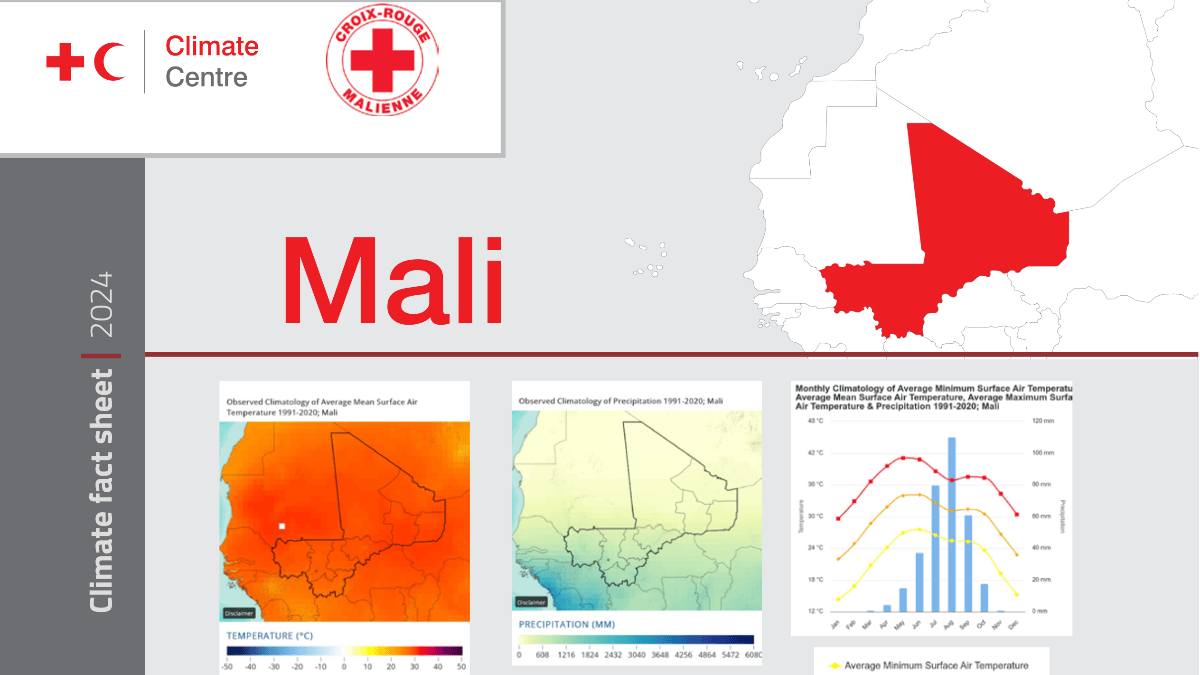
Red Cross climate scientists map how conflict, drought, and flooding converge in one of the world's most climate-vulnerable countries to inform humanitarian action.
"The community had hoped to sink a borehole to access water, which was vital to their livelihoods and survival," said Papa Amadou Gueye, an ICRC team member. "However, it turned out that the sub-soil was too dry. It was both frustrating and worrying." Fortunately for the people of Tin Tanzan, the third drilling attempt proved successful: water was finally found ten kilometres from the first borehole.
Traditional ground surveys miss what satellites can see: subsurface geological patterns, underground aquifer systems, and areas where rainfall hasn't replenished water tables for years, though not which routes are controlled by armed groups or where recent violence has occurred. So integrating satellite intelligence with conflict mapping could change how humanitarian organizations respond to crises in places like Tin Tinzan where environmental disasters and armed conflict collide.
Community-Driven Data Meets Satellite Precision
Work at the Climate Centre signals the paradigm shift in humanitarian response. Instead of siloed data analysis and decision-making, remote analysis can identify patterns, predict risks, and guide local action. It's a bridge between local realities and global perspectives, and sheds light on the intersections of climate, conflict, and displacement and their impact on vulnerable communities.
"Satellite monitoring, especially climate observations, gives us information about areas we can't access in person," Scholz said. "I'm able to analyze the impacts of climate change projections on communities all around the world whether there is on-the-ground technical information or not."
Satellite data reveals environmental changes over time-expanding deserts, shifting river courses, degrading vegetation-while automated systems monitor weather patterns and impacts of climate-related hazards or violent conflict in near real-time.
"Having accurate, high-resolution, openly available data is really amazing," Scholz said. Data that was once restricted to military and intelligence agencies is now accessible to humanitarian organizations.
For Scholz, the breakthrough came when she saw the power of combining open-source GIS data and remote sensing imagery with community-generated data. Working directly with the Mali delegation of theInternational Committee of the Red Cross, she developed a water borehole stress index that fuses satellite data with local information about conflict, vulnerabilities, and water access.
The delegation's Water and Habitat unit (WatHab) systematically collected GPS coordinates and condition data for water points. This ground-truth data was transmitted to the Climate Centre where it was used as baseline data set and analyzed using georeferenced data of vulnerabilities, conflict and environmental factors along with satellite climate observations. This creates a comprehensive risk assessment.
Now, water engineers can prioritize which boreholes need intervention based on combined environmental and security risk, not guesswork.
"This is an innovative case where the national society collected primary georeferenced data from the field and asked for support to analyze it and put it into a bigger picture of climate, conflict and vulnerability," Scholz said. "The push to use geospatial analysis came from the Mali teams, not an outside influence."
The stress index analyzes twelve indicators across four dimensions: social vulnerability, pressure on water use, climate, and conflict. The conflict dimension tracks three factors using automated monitoring from ACLED (Armed Conflict Location & Event Data). First, number of violent conflict incidents near water boreholes indicates the likelihood of physical damage from violence. Second, fatalities in wider areas around water points indicates the intensity of the conflict in the area where people are attempting to access water. Third, targeted violence against civilians indicates whether certain community members might be prevented from reaching vital water sources due to ethnic, religious, or political targeting.
For communities in Mali and similar situations worldwide, this integration of satellite capabilities with local leadership shapes daily survival decisions and offers hope for resilience.
"For me, the biggest reward I have is if the work I do has a positive impact on communities and on people," Scholz said.
Learn more about how GIS is used to prepare, manage, and deliver effective humanitarian assistance.
Reshaping Humanitarian Response with Geographic Solutions
Recent funding disruptions have exposed vulnerabilities in humanitarian aid and forced a transformation to community-driven networks. This shift reflects the geographic approach used by the Red Cross Red Crescent Climate Centre.
The approach makes sense. When disaster strikes, risk follows geography. A person's proximity to hazards, plus the quality of nearby buildings and infrastructure, impact their vulnerability. All are spatial factors and keys to successful humanitarian action.
Esri's National Disaster Risk Management Geospatial Capacity Program (NDRM GCP) and Geospatial Enablement Program support this transformation.
The programs democratize access to GIS tools-providing resource-constrained countries with advanced mapping technologies. Local leadership and national disaster management authorities can use these GIS tools to make data-driven decisions. Municipalities and countries can build from within, combining accessible licensing with comprehensive training for local teams.
The result? Countries build resilient response strategies and early warning systems aligned with national development goals and locally determined priorities.