Please help us improve PreventionWeb by taking this brief survey. Your input will allow us to better serve the needs of the DRR community.
Geomojis translate geoscience across any language
Newly created pictograms aim to easily communicate geoscience and geohazard terms.
By Megan Sever
Emojis are pictograms used to convey particular messages. They have the same basic meaning in any language: A smile means a smile.
What if the geoscience fields could create their own pictograms that anyone, anywhere, could understand, like a tsunami evacuation zone or a rockfall warning? That’s what volcanologist Benjamin van Wyk de Vries and his team are aiming to do. “We want to communicate Earth sciences in a way that is easily understandable to everybody,” van Wyk de Vries said.
Enter geomojis.
Geomojis are “a global symbology for communicating geosciences…[and they] bridge the gap between simple symbols and words, crossing language borders,” noted van Wyk de Vries and his colleagues, including linguist Claire Shires and several other language experts from the Université Clermont Auvergne in France, in a presentation at the European Geosciences Union (EGU) General Assembly 2021.
Layman’s Glossary
Geomojis are the brainchild of van Wyk de Vries, who started drawing them based on a global framework of geoscience terms to describe Earth and its processes—like a layman’s glossary of geology.
Van Wyk de Vries teamed with linguists to ensure his wording and pictograms were useful for communicating geological hazards and processes to the public. To date, the team has come up with a glossary of 50 different geoscience-related terms, mostly relating to hazards: from earthquake to lahar, tsunami to flash flood.

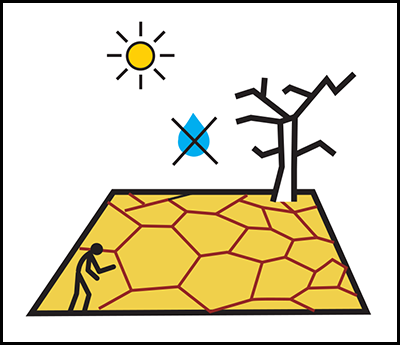
Some terms are easier to explain than others, but all must have a human connection, van Wyk de Vries said. Consider drought.
When trying to explain drought to Shires—who has no geoscience background and thus is a good guinea pig, she said—the team realized that the drought definition needed human connotations; it’s not just a natural term. “The definition we had for the glossary was rather dry, if you’ll excuse the pun. We left out the most important thing: the human connection,” van Wyk de Vries said. So when he draws geomojis now, he draws a little person or a house with the hazard—something that conveys the human aspect.

Illustration and Language

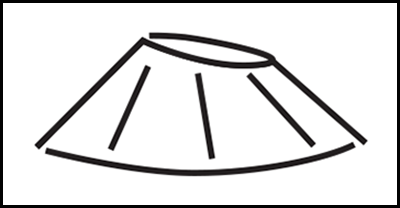
Drawing pictograms that communicate a hazard or an Earth process effectively is half the battle. For example, van Wyk de Vries drew a volcano shaped like a scoria cone “that I thought would be so obvious,” he said.
Shires, however, looked at the pictogram and saw only the hole, the caldera. This illustrated how important it is to test these geomojis on different people, van Wyk de Vries said.
The other half of the battle is language. There’s a cultural aspect, in that many cultures have words to describe processes that don’t translate to other languages (like jökulhlaup in Icelandic, a type of volcano-induced glacial outburst flood). And there’s a geoscience aspect: Geoscientists don’t define or draw terms exactly the same way. Van Wyk de Vries said he showed some initial pictograms to a group of lithosphere specialists at a previous EGU meeting and “immediately got flak for how I had drawn convection in the mantle—this wasn’t right, that wasn’t right.” But the feedback was useful and necessary, he said. Some scientists later circled back to van Wyk de Vries and offered their own drawings to help the project.
This is how van Wyk de Vries and Shires see the project growing: like Wikipedia, a crowdsourced endeavor in which people everywhere contribute definitions and pictograms, and also adapt and modify them for local context and needs. There would have to be some oversight to ensure accuracy. But a global glossary with hundreds of geomojis could be useful for everyone, from government officials to tourists to elementary school students—as long as they are connected and tell a narrative of the Earth that is understandable to all, van Wyk de Vries said.
The geomoji glossary may even include animations and mind maps to describe various processes that are all part of a single term, like volcano, with further geomojis explaining explosive versus effusive eruptions.

This is just the beginning, van Wyk de Vries and Shires said.
Los geomojis traducen la geociencia a cualquier idioma (Spanish)
Explore further
Please note: Content is displayed as last posted by a PreventionWeb community member or editor. The views expressed therein are not necessarily those of UNDRR, PreventionWeb, or its sponsors. See our terms of use
Is this page useful?
Yes No Report an issue on this pageThank you. If you have 2 minutes, we would benefit from additional feedback (link opens in a new window).