Deterministic and probabilistic risk

Why is disaster risk harder to see than it looks?
How do you plan for disasters that have not happened yet?
When a major disaster hits, it feels unprecedented. Yet many other events could have caused even more damage – in some cases severe – but have not happened yet. This is where the challenge begins for decision-makers.
If we focus only on the past, we risk developing a false sense of safety. Today's world is highly connected, so future disasters will look very different from historical ones. Cascading impacts, system failures and cross-border effects can amplify risk in ways we have not previously experienced.
To prepare effectively, experts use two different tools to measure risk: deterministic and probabilistic risk assessment.
What is the difference between deterministic and probabilistic risk?
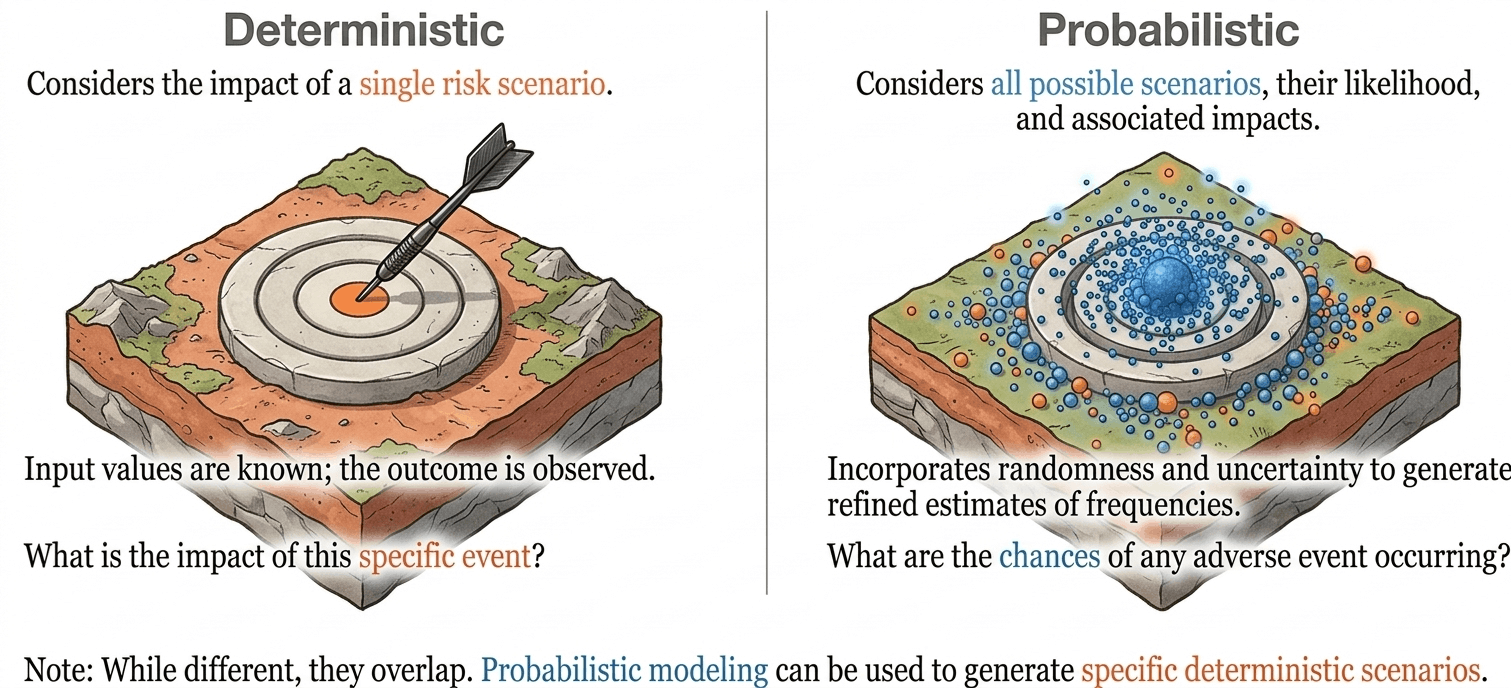
One examines a specific event; the other explores every event that could occur
If past disasters alone cannot fully describe future risk, the next question is how risk should be analysed in practice. Disaster risk assessments approach this in two complementary ways: by examining the consequences of specific events, and by exploring the full range of events that could occur over time.
What is deterministic risk assessment?
It focuses on the impacts of a single, clearly defined hazard – a flood like one experienced in the past, a severe but plausible earthquake, or a hazard with a chosen return period. Fixing the event gives a detailed picture of consequences, useful for testing emergency plans, infrastructure performance or specific risk reduction measures.
What is the impact of this specific event?
What is probabilistic risk assessment?
It examines thousands of scientifically plausible events and estimates how often different levels of loss may be expected over time, with their likelihood and uncertainty. Risk becomes a spectrum of possible futures, from frequent low-impact events to rare catastrophic losses.
What are the chances of any adverse event occurring?
However, disasters rarely unfold according to a single, expected scenario: analysing one event does not show how likely it is to occur. Probabilistic assessment addresses this limitation, so risk is seen not as a single outcome, but as a distribution of possible outcomes.
In practice: case studies from GAR 2025
Deterministic · Earthquake
Seismic risk assessment of schools in the Dominican Republic
Latin America and the Caribbean is the second-most disaster-prone region in the world. Through a UNESCO project launched in 2020, local engineering and architecture students were trained to assess the earthquake vulnerability of schools.
Inspectors identified risks and retrofitting opportunities at 85 schools across five municipalities, helping governments target resources
Probabilistic · Flood
Climate risk and adaptation for transport networks in East Africa
Flooding poses a significant threat to transport across East Africa. Given the scale of the challenge, identifying where and how to prioritise resilience investment is key.
An assessment of networks in Kenya, Tanzania, Uganda and Zambia modelled future impacts on supply chains and trade flows, and tested adaptation options for road and rail.
When should you use each approach?
The two approaches are complementary, not competing
Deterministic analyses help decision-makers understand the consequences of specific events, while probabilistic assessments place those events in context by showing how likely they are and how they compare to other outcomes. Together, they provide a more complete foundation for disaster risk management in an increasingly uncertain world.
Use deterministic analysis to…
design and evaluate specific measures, and understand in depth how a disaster unfolded – as a forensic investigation does. It works like a stress test: can a hospital cope with a major earthquake?
Use probabilistic analysis to…
understand long-term risk, fiscal exposure and the full distribution of possible losses, especially as climate change and socio-economic development reshape hazard patterns.
Combine them to…
generate multiple deterministic scenarios from a probabilistic model: worst case (maximum losses), best case (losses that can be absorbed) and most likely.
Focusing on one “worst-case” or “most likely” event can create a misleading sense of certainty. A worst case may seem so extreme it feels unrealistic, while a “most likely” scenario may understate rare but catastrophic losses. Without knowing how probable each scenario is, it is difficult to judge how much attention or investment it deserves.

What does a 1-in-100-year flood really mean?
Return periods describe chance, not timing
Expressions such as “a 1-in-100-year flood” or “a 1-in-200-year earthquake” are widely used in disaster risk reduction, yet often misunderstood in ways that seriously distort how people perceive risk.
A 1-in-100-year flood does not mean once every 100 years, or that a place is safe for the next 99. It is a flood with a 1% chance of being exceeded in any given year. That same flood can happen this year, next year, or several times in a lifetime.
Probability does not work like a calendar. Each year is a new roll of the dice – a recent flood does not reduce the chance of another one soon.
Enlarge image>
Source: UNDRR
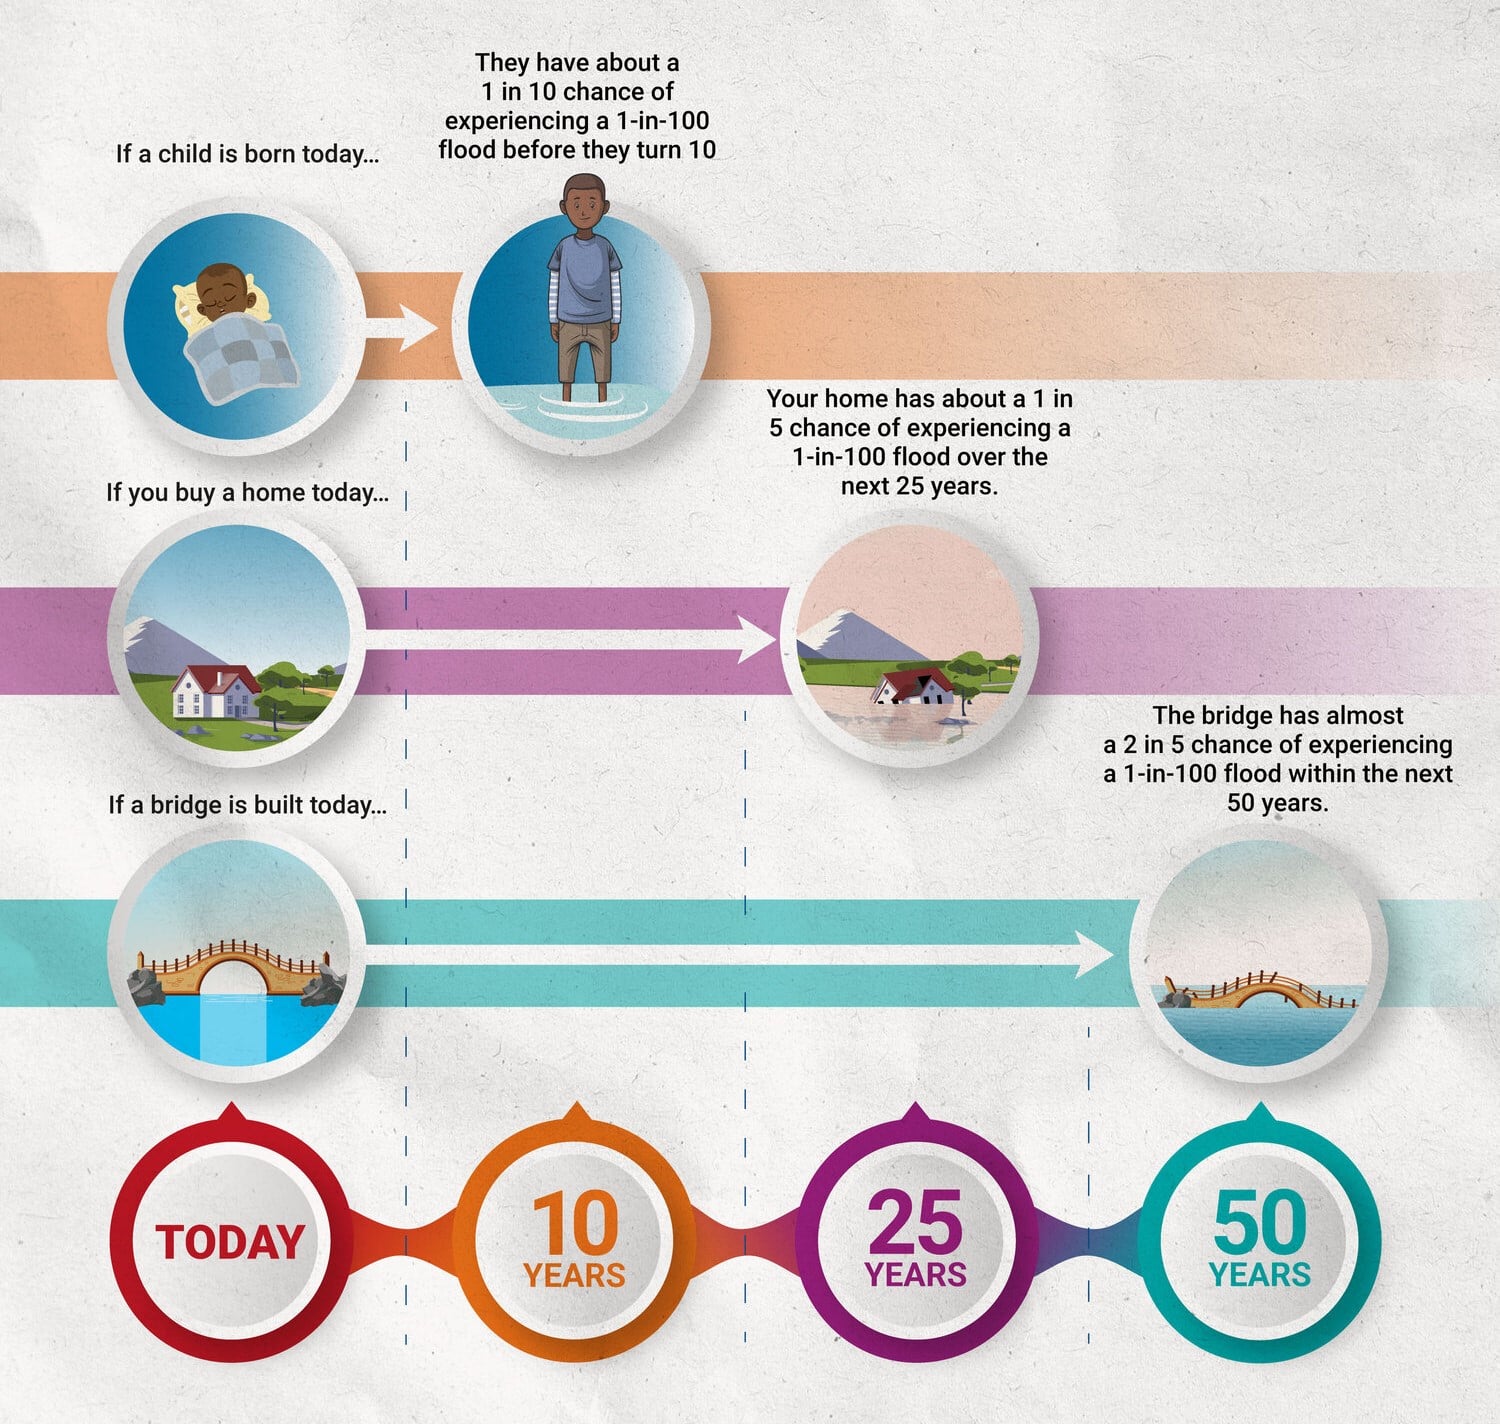
Over a lifetime, the odds add up. A child born today has about a 1 in 10 chance of experiencing a 1-in-100 flood before they turn 10. A home bought today has about a 1 in 5 chance over 25 years, and a new bridge almost 2 in 5 over 50 years.
Return periods compare levels of risk
Return periods are best understood not as predictions of when disasters will occur, but as tools for comparing levels of risk. As hazard intensity increases, likelihood typically decreases but potential damage increases: small events happen more often, very severe events are rarer.
More frequent, smaller losses
Annual chance of being exceeded
Rarer, but significantly larger impact
A 1-in-200-year event has a lower annual probability than a 1-in-50-year event, but if it occurs, the impact is significantly larger. Risk assessment considers both dimensions together: it is the combination of probability and impact that determines overall risk.
Why is probabilistic assessment becoming the standard?
It quantifies impact and likelihood, and accounts for uncertainty
Assessing risk probabilistically remains a challenge: there are many factors to account for, and risk is not static – it is increasingly influenced by drivers such as climate change. But because it is the more comprehensive approach, probabilistic assessment is becoming the standard for disaster risk assessment.
What is uncertainty in risk modelling?
Precise numbers are not the same as accurate ones
Few findings from natural and social science are 100% certain, owing to the natural randomness of hazards and incomplete knowledge. Even so, we still have to make decisions to build resilience.
A model may show that a 1-in-100-year flood will affect 388,123 people, but the accuracy of the model and data may only support an order-of-magnitude estimate. Likewise, sharply drawn flood zones can lead to critical facilities being placed just outside the line, where the actual risk is the same as inside it.
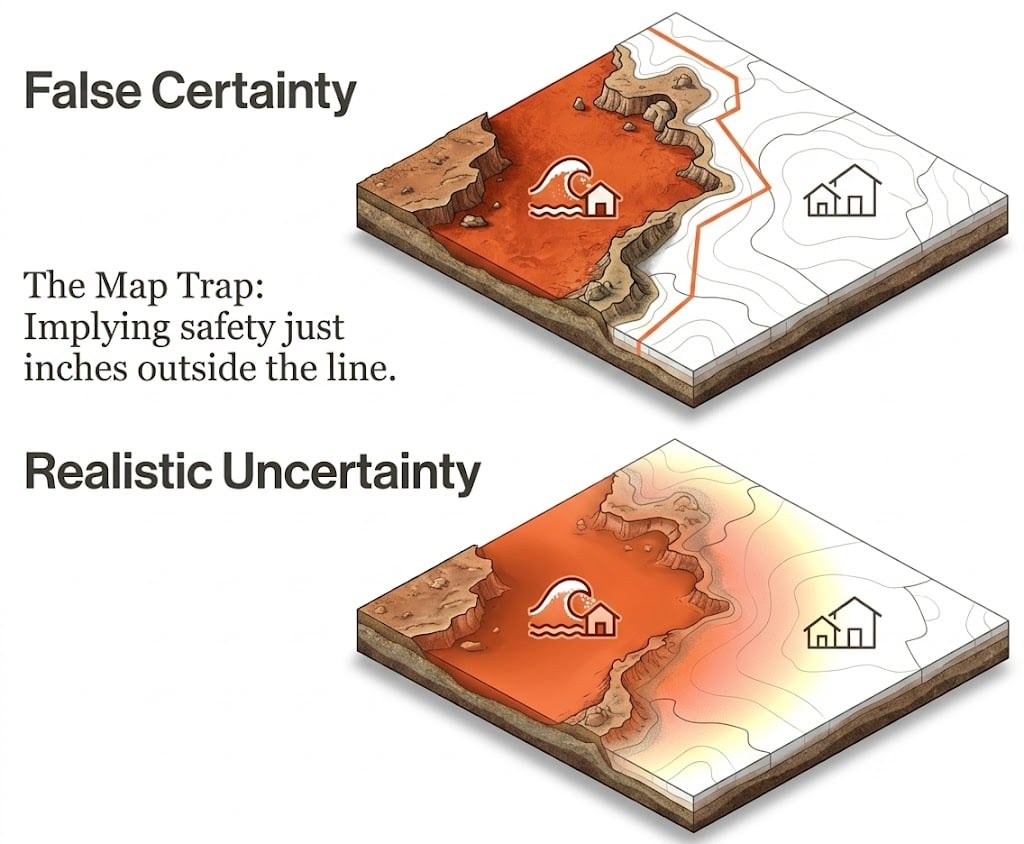
The map trap
A hard line on a hazard map implies safety just inches outside it. Realistic maps show risk fading gradually across the boundary.
Uncertain information is still useful, as long as decisions are made with a full understanding of its implications. Uncertainty prompts debate that leads to more robust decisions, and credible science always presents it clearly.
We cannot wholly rely on our knowledge of past events to anticipate future risk, because some disasters that could happen have not yet happened.
How do we model deterministic and probabilistic risk?
The same components, used in two different ways
Risk models are built from components (sometimes called modules) for hazard, exposure, vulnerability and loss (or impact).
Deterministic models
Output is fully determined by the parameter values and initial conditions. Used to assess specific events: historical events, worst cases, or events at chosen return periods – e.g. building damage, mortality and economic loss from one scenario.
Probabilistic (stochastic) models
Incorporate randomness, so the same inputs produce a group of outputs. Using historical events, expert knowledge and theory, they simulate events that are physically possible but not yet observed, building a catalogue of events, probabilities and losses.
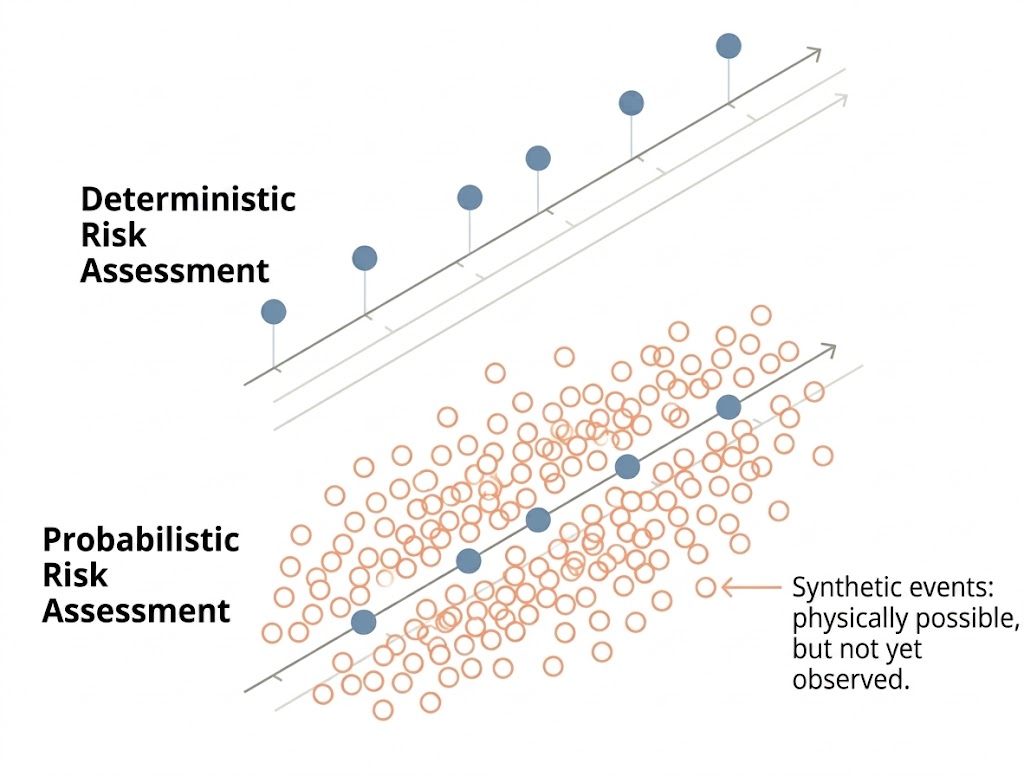
Models are used probabilistically when an event set contains enough events for the risk estimate to converge at the longest return period of interest. Probabilistic models can also run a deterministic analysis by entering the parameters of a specific event. While data remain incomplete, they give guidance on the likely order of magnitude of risk – provided their uncertainty is recognised.

What are AAL and PML?
Risk metrics: the key for resilience
Probabilistic model results are presented as standard metrics. Each gives a different view of the same risk.
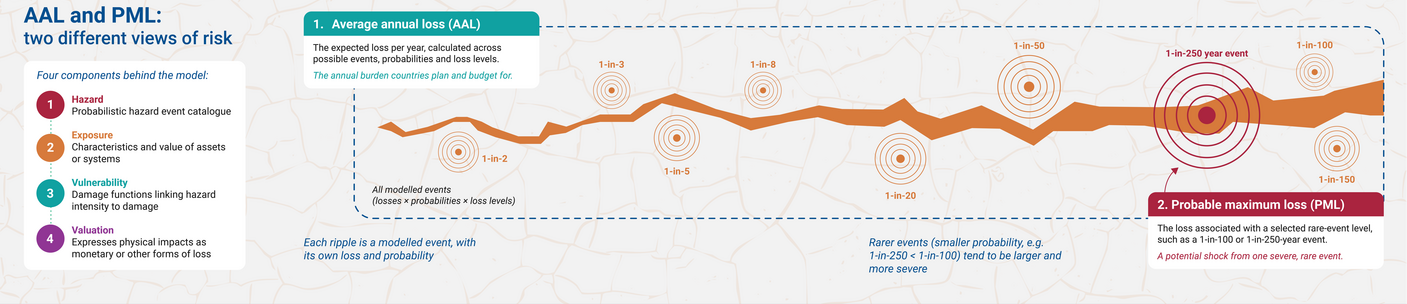
Enlarge image >
The expected loss per year considering all events that could occur over a long time frame, including very intensive losses. A compact metric with low sensitivity to uncertainty that overcomes the limits of historical loss data.
The loss at a selected return period, such as 1-in-100 or 1-in-250 years. Even for a 1,000-year return period there is a 5% chance of exceedance over 50 years – key for infrastructure with a 50-year lifespan.
Most probabilistic assessments were developed commercially for the insurance industry, mainly in higher-income countries, and rely on proprietary models. Public-domain models are growing, but differing methods and data sets make comparison difficult.
Uncertainty is directly linked to the quality of input data, and some random uncertainty cannot be reduced. Where historical data are missing, expert judgement and proxies are used, and results are sensitive to these assumptions. Outputs should be read as indicators of the order of magnitude of risk, not exact values.
Probabilistic risk in action