
How many people died? Why counting disaster fatalities is harder than it looks
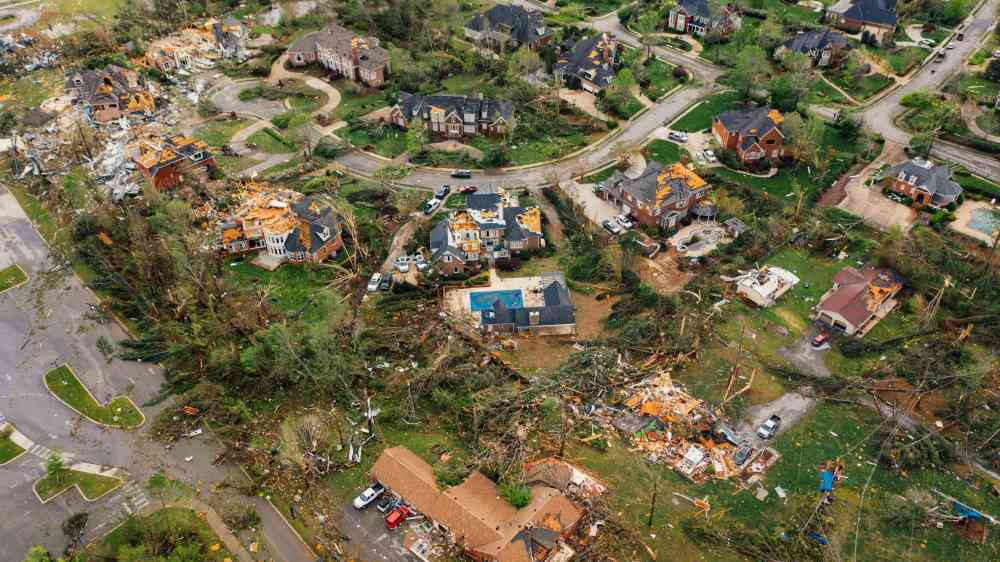
A hazard event occurs. Imagine that the first report says 20 people have died. By the evening, the number is 27. The following day, authorities report 23. A week later, some people initially reported missing are confirmed alive, while others previously listed as injured have died. Which number is correct?
The obvious answer is the latest one.
But the problem is more complicated than changing numbers over time.
Before we can count disaster fatalities, we need to answer a set of more fundamental questions: What exactly was the event? Which deaths were caused by it? How directly were they connected? And what evidence do we have?
Disaster fatality data are therefore not simply collected. They are interpreted, classified, attributed, verified, and revised. This is part of a broader challenge in disaster loss and damage databases, where definitions, thresholds, reporting practices and data sources can strongly influence what ultimately gets recorded - a pattern documented in studies of missing data in the Emergency Events Database (EM-DAT) , loss-data fallacies and flood loss databases .
Here we focus specifically on the challenges of accounting for disaster fatalities.
Before counting deaths, we need to define the event and the causal pathway
Consider what happened during Typhoon Maysak in southern China in July 2026 . Heavy rainfall associated with a storm caused flooding in Guangxi, where a reservoir embankment was breached and a snake-breeding farm was flooded. Around 800-900 snakes escaped, including venomous species. Several people were bitten and at least one person died following a snakebite. Reports also indicated delays in accessing medical care contributed to the circumstances surrounding the fatality. An illustrative causal pathway of the reported snakebite fatality is represented in Figure 1:
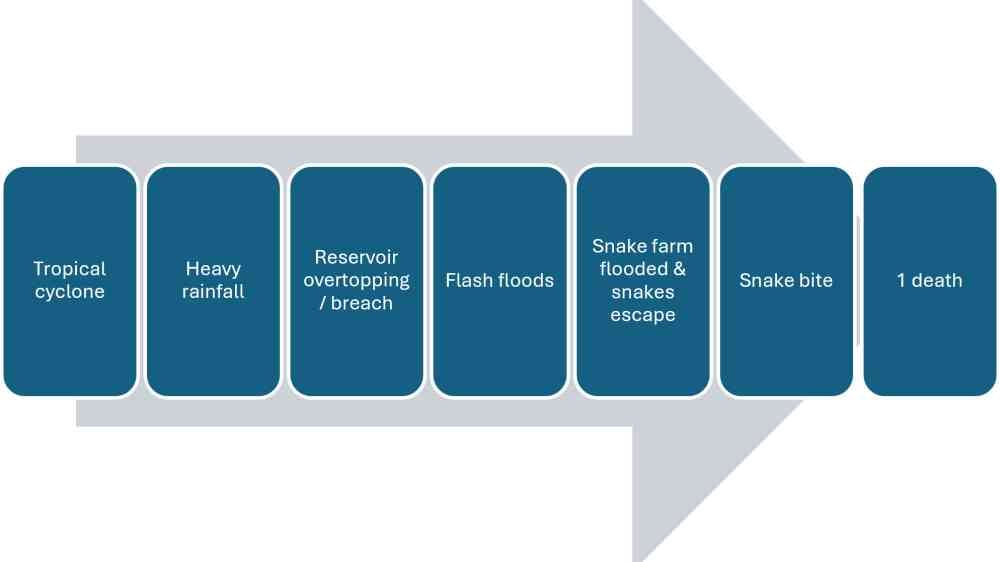
So how should this death be recorded? As a snakebite death? A flood-related death? A consequence of the reservoir failure? A typhoon-related death? Or an indirect disaster fatality?
There is no universally obvious answer because each label answers a slightly different question. Mortality registries typically seek the underlying cause of death: the disease, the injury or the circumstances that initiated the chain leading to death. Disaster databases, instead, often link deaths with a particular hazard event, including direct and indirect consequences.
Therefore, the same fatality can occupy several positions in a causal chain. It may be a “snakebite death” in a health or mortality registry, a “reservoir breach consequence” in infrastructure analysis, a “rainfall-related death” or a “flood related indirect death” in a disaster database. None of these labels are necessarily wrong. A disaster fatality can thus pass through multiple interpretive layers before becoming a database entry, and each layer may legitimately produce a different label.
This distinction matters because disaster databases often use the event as their basic unit of analysis. Yet defining the boundaries of an event can itself be difficult, particularly when hazards cascade or occur simultaneously. A tropical cyclone can generate heavy rainfall, flooding, landslides, infrastructure failures and secondary impacts, while a single fatality may result from several links in that chain. The challenge is therefore not only to count deaths, but to decide which event and causal pathway those deaths belong to.
Typhoon Maysak’s official death toll rose from 39 to159 over the six weeks, according to the South China Morning Post . Several causal chains may be established to better understand the reasons for the deaths due to the event. A hypothetical causal pathway of disaster deaths is presented in Figure 2.
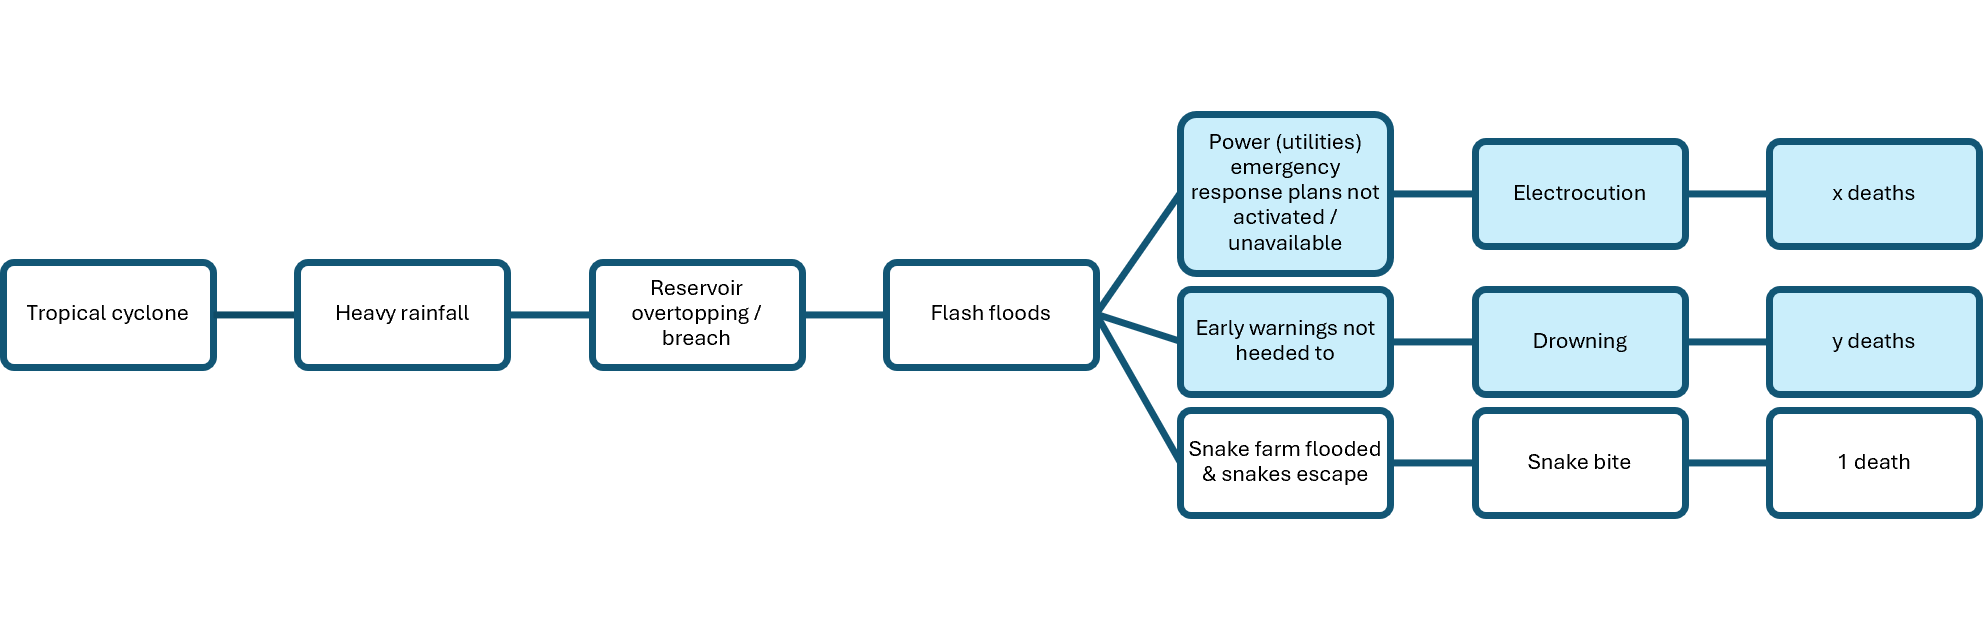
A causal pathway requires decisions about where the event starts, when its effects end, and how confidently each death can be attributed.
Defining the main event (start point of the causal chain)
Disaster databases often require an event as the unit of analysis, although defining one event is difficult. A World Meteorological Organization (WMO) / United Nations Development Programme (UNDP)review of 91 post-disaster needs assessments (PDNAs) highlights recent efforts by WMO to develop a globally accepted standard for determining the temporal or spatial extent of a hazard event.
The same document also highlights that only 20% of the PDNAs involved consultations with the National Hydrological and Meteorological Services. This matters directly for fatality attribution because understanding the initiating hazard and its evolution requires hazard expertise. If a report says “landslide deaths,” hazard experts may help determine whether the event was rainfall-triggered, earthquake-triggered, construction-related, mining-related, or part of a compound flood-landslide event. If a death follows a dam breach, hydrological and infrastructure expertise can help distinguish the initiating rainfall, the failure mechanism, downstream flood wave and later exposure pathway.
The WMO Cataloguing of Hazardous Events approach offers one potential building block. By providing events with unique identifiers, recording temporal and spatial parameters, it can help link related or cascading hazards and associated impacts. This does not completely remove uncertainty, but it helps prevent complex chains from being flattened into one misleading hazard label.
Defining the temporal boundary
Not all deaths due to disasters happen immediately. The Hillsborough stadium disaster, for example, caused 94 immediate deaths and 766 injuries, with 300 hospitalizations, in 1989. According to a contemporary timeline , the latest recognized death due to the event - the 97th - was confirmed in 2021, 32 years after the incident. The delayed death was recognized because a documented causal chain remained. Many disasters lack comparable long-term records and institutional follow-up. This creates systematic differences in what can later be recognized.
Physical injury is not the only pathway through which a disaster may contribute to later mortality. Hillsborough survivors also experienced long-term trauma, and some died by suicide . Disasters may contribute to trauma, bereavement, displacement, social isolation or substance-related harm, and these pathways can contribute to later mortality. Establishing causation for an individual case is, however, more difficult than identifying increased mortality at the population level.
While counting deaths, we are actually counting reports about deaths
Much of what we know about disaster fatalities comes through an information system that is itself imperfect. A death that occurs in a remote community with little media coverage may never enter an international database. A death in a major city may generate dozens of independent reports. Official emergency management sources may record events requiring institutional intervention while smaller events remain undocumented. Comprehensive disaster databases therefore often need to combine official records with media reports, local sources and other forms of evidence.
Disaster deaths also get lost in the noise of conflicting reports on the actual death toll. The landslide in Papua New Guinea in May 2024 illustrates this. Early media articles indicated over 2,000 individuals buried while other articles reported 670 deaths and, later, 200. That is a difference of about 1,800 individuals from the earliest estimate. Uncertainty arises not only because sources provide different numbers, but because they may be counting different things — such as estimated people buried, estimated deaths, confirmed or recovered bodies, directly affected people, or retrospective estimates.
Similar irregularities in media reporting that results in high uncertainty are common in outlier events such as earthquakes. The Kashmir earthquake in 2005 with an epicenter in Muzaffarabad affected Azad Jammu and Kashmir region administered by Pakistan, Khyber Pakhtunkhwa, areas in Afghanistan, and some areas of Jammu and Kashmir region, India. The death toll in Pakistan ranges from 87,350 to more than 100,000 - an uncertainty of almost 13,000 people.
Reports may also be in vernacular languages, use local hazard terminology, or translated differently across languages. A term translated as “landslide” may refer to a debris flow, slope collapse, embankment failure, quarry wall failure, construction-site collapse or broader rain-related ground failure. Official district-level statements may give only aggregate numbers such as “five dead, 20 injured”, without explaining whether the deaths occurred by drowning, collapse, electrocution, explosion, disease, evacuation accident or delayed medical access. These examples show that hazard datasets must work with partial visibility, language effects and evolving source quality.
Actual deaths ≠ reported deaths ≠ verified deaths ≠ database deaths.
The database is therefore not simply a mirror of reality. It is also a record of what became visible, what could be verified and what could be attributed from the available evidence.
This raises a broader question: if disaster fatality data are inherently evolving, uncertain and dependent on how events and causal pathways are defined, what should a good disaster fatality accounting system look like?
What should we do differently?
Build on existing data systems
More research is needed on the standardization of disaster fatality accounting and on the requirements for disaster fatality registries at different levels - from local and national systems to global disaster databases.
There are already useful examples to build on. In landslide death mapping, specific methodologies and databases have been developed, including NASA's Global Landslide Catalog and the Global Fatal Landslide Database . Recent work has also proposed frameworks for linking landslide inventories with loss and damage reporting . At the global level, EM-DAT provides a major compilation of disaster-related losses and impacts. The emerging WMO approach to cataloguing hazardous events could provide another important building block, by supporting more consistent identification and linking of hazard events.
Connect multiple sources and causal pathways
A key requirement is to move beyond reliance on a single source of information and systematically combine multiple sources, with mechanisms for corroboration, verification and revision.
The opportunity is to move towards interoperable and mineable disaster fatality datasets that recognize the complexity of compiling, interpreting, attributing and maintaining fatality information.
Such systems should not only record how many people died but also preserve the causal pathway through which deaths occurred. This could allow fatality data to be used not only for counting impacts, but also for understanding where vulnerabilities emerge along the disaster chain and where risk reduction measures might intervene.
Preserve how the evidence evolves
Finally, the evolution of the evidence itself should be preserved. A fatality database should not simply replace yesterday’s estimate with today’s number. It should retain the trajectory of the information: what was initially reported, what was subsequently verified or revised, what evidence led to the revision, and what remains uncertain.
In other words, a disaster fatality database should preserve not only the number of deaths, but also the event, the causal pathway, the evidence and the evolution of our understanding.
When we say that a disaster killed 20 people, we are not simply reporting a number. We are making a series of decisions about what the event was, how deaths were connected to it, what evidence was available, and how certain we are. Those decisions are often invisible once the number enters a database.
Improving disaster fatality accounting is therefore not simply a data-management exercise. It is part of improving how we understand disaster risk itself.
Why better counting matters
This matters because disaster fatality data are not only used to describe what happened. They are also used to measure whether disaster risk is being reduced. The Sendai Framework includes a global target to substantially reduce disaster mortality by 2030. We therefore use disaster fatality data to assess progress towards reducing disaster risk. But how confidently can we claim progress if the way disaster deaths are identified, attributed, classified and revised remains so difficult to standardize?
Further examples and an evolving compilation of disaster fatality data and sources are available in Deaths, injuries, evacuations due to hazard events as part of the Disaster Risk Intelligence Hub .
Lakshman Srikanth is a Senior Advisor at Deltares, working on disaster risk management, & resilience. His work focuses on disaster vulnerability and risk assessment, risk management planning, and translating evidence and data into practical approaches for reducing disaster risk.
Professor David Petley is Vice-Chancellor and President of Nottingham Trent University and a leading researcher in landslide hazards and risk management. He is the author of the Landslide Blog on Eos, the science magazine of the American Geophysical Union, where he provides analysis and commentary on landslide events, research and disaster impacts worldwide.