Global Assessment Report on Disaster Risk Reduction 2015
Making development sustainable: The future of disaster risk management |
Global Assessment Report on Disaster Risk Reduction 2015
Making development sustainable: The future of disaster risk management |
|
|
64
Part I - Chapter 3
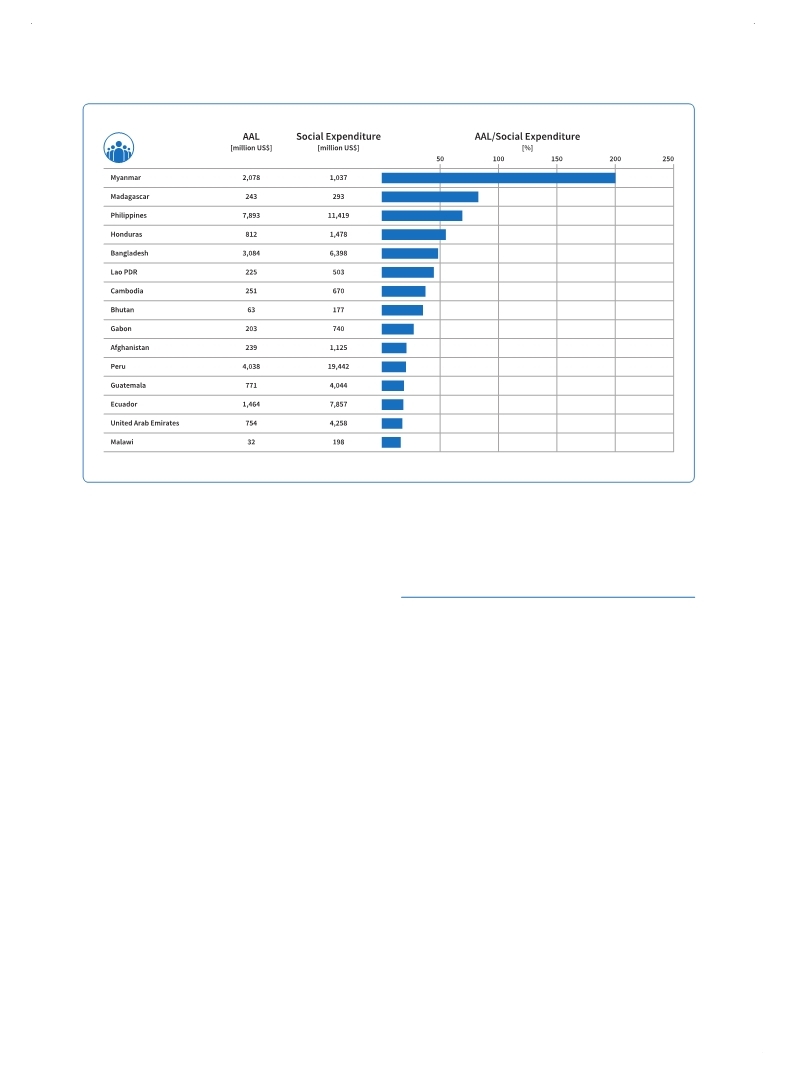
Figure 3.11 Top 15 countries: Multi-hazard average annual loss in relation to social expenditure (excluding SIDS)
(Source: UNISDR with data from Global Risk Assessment and the World Bank.)
again highlights that those objectives cannot be achieved unless disaster risk is addressed.
A number of larger countries like Myanmar, Madagascar, Philippines and Honduras face particularly difficult challenges in this regard, as the AAL represents almost 55 per cent of social expenditure in Honduras, nearly 69 per cent in the Philippines, more than 80 per cent in Madagascar and 200 per cent in Myanmar (Figure 3.11). In Latin American countries like Ecuador, Guatemala and Peru, the AAL represents over 15 per cent of annual social expenditure.
3.3 Hazard-specific risk profiles
Different hazards can be seen to represent different risk layers and are therefore associated with various levels of frequency and impact. It is important to understand the implications of these different hazards and the way that they interrelate with drivers of vulnerability and exposure to create specific patterns of risk.
The AAL figures used for these estimates aggregate the expected annual losses from different hazards (Figure 3.12), which in turn represent different risk layers. For example, tsunamis are usually associated with very low-frequency but high-severity impacts, while tropical cyclones have a much higher frequency and usually medium to high severity of impact. Earthquakes are lower-frequency events that can cause greater losses, i.e. generate significant damage across large areas of a country, while floods are more
|
 
Page 1Page 10Page 20Page 30Page 40Page 50Page 54Page 55Page 56Page 57Page 58Page 59Page 60Page 61Page 62Page 63Page 64Page 65->Page 66Page 67Page 68Page 69Page 70Page 71Page 72Page 73Page 74Page 75Page 76Page 77Page 78Page 80Page 90Page 100Page 110Page 120Page 130Page 140Page 150Page 160Page 170Page 180Page 190Page 200Page 210Page 220Page 230Page 240Page 250Page 260Page 270Page 280Page 290Page 300Page 310
|
|
 
|
 
|