Global Assessment Report on Disaster Risk Reduction 2015
Making development sustainable: The future of disaster risk management |
Global Assessment Report on Disaster Risk Reduction 2015
Making development sustainable: The future of disaster risk management |
|
|
188
Part III - Chapter 9
like Denmark can exceed US$12,000 per inhabitant, in many low-income countries it is less than US$5 per inhabitant (Satterthwaite and Dodman, 2013
Satterthwaite, David and David Dodman. 2013,Towards resilience and transformation for cities within a finite planet, Environment and Urbanization, Vol. 25, No. 2: 291-298.. . While the impact of disaster on poverty has been documented repeatedly, what is missing is the recognition that disaster risk, and particularly extensive risk, is part of the DNA of poverty and inequality. In other words, it is rooted within poverty and not an externality.
Studies on the geography of risk often still present disasters and climate change impacts as a simple function of the hazard exposure of lowincome populations. For example, a recent projection states that 325 million extremely poor people will be living in the 49 countries most prone to hazards in 2030, and therefore eliminating poverty cannot be achieved without addressing disasters (Shepherd et al., 2013
Shepherd, Andrew, Tom Mitchell, Kirsty Lewis, Amanda Lenhardt, Lindsey Jones, Lucy Scott and Robert Muir-Wood. 2013,The geography of poverty, disasters and climate extremes in 2030, Overseas Development Institute, MetOffice and RMS. October 2013.. . 9.2 Inequality and disaster risk
The social processes that drive the disaster risk– poverty nexus are permeated with inequality. Inequality increases income poverty and creates processes of social and political exclusion. The result is a lack of social cohesion that contributes to disaster risk by eroding accountability and enabling corruption.
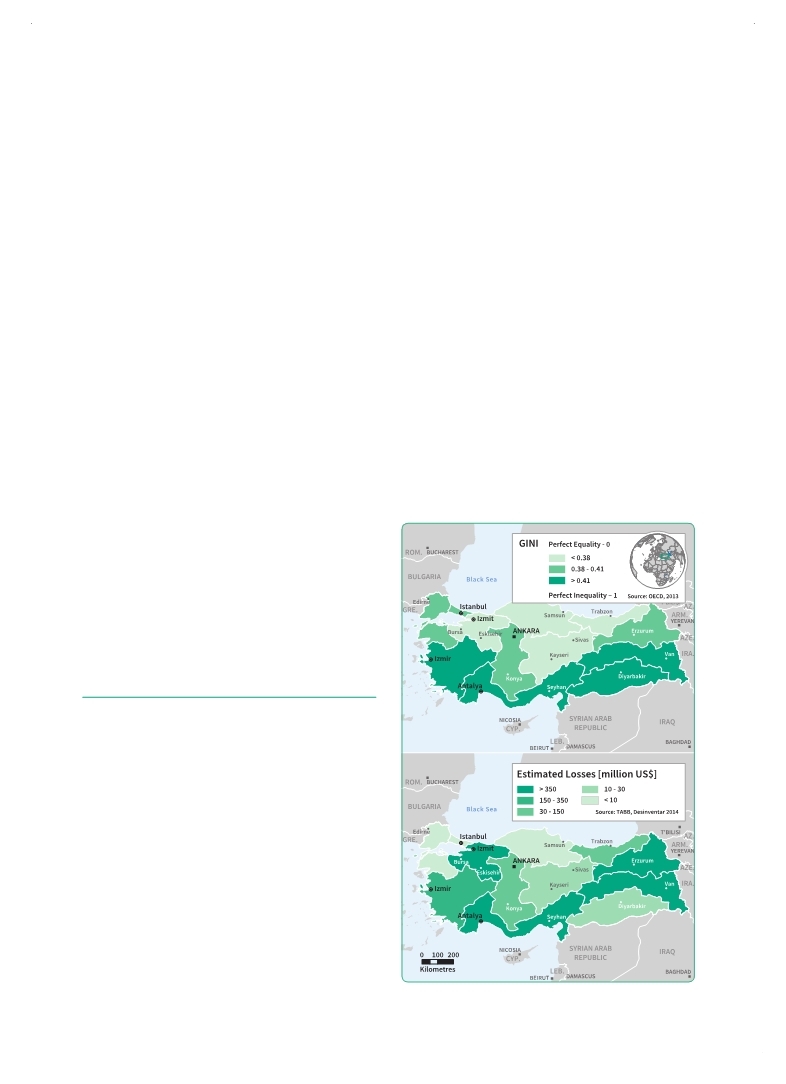
In Turkey, an upper middle-income country, income inequality has been decreasing over the last 30 years. However, this decrease began from a high starting point, and today the country still ranks second among OECD countries in terms of income inequality.7 While the number of people
living below the poverty line has decreased dramatically over the last 10 years, the poverty threshold for Turkey has continuously risen. In 2013, it was calculated at US$509 per month, which is significantly higher than the official poverty line.8
Inequality and poverty are highest in the southern and eastern regions of the country, which are less populated than the urbanized north and western coast. With the exception of losses associated with the large earthquake in Izmit in 1999, disaster losses in general reflect the distribution of inequality (Figure 9.4).
The social processes and power dynamics that drive the disaster risk–poverty nexus are permeated with inequality. Inequality (Box 9.2) drives
Figure 9.4 Inequality and disaster losses in Turkey
(Source: UNISDR with data from the Turkish Disaster
Data Bank (TABB) and OECD.)
|
 
Page 1Page 10Page 20Page 30Page 40Page 50Page 60Page 70Page 80Page 90Page 100Page 110Page 120Page 130Page 140Page 150Page 160Page 170Page 178Page 179Page 180Page 181Page 182Page 183Page 184Page 185Page 186Page 187Page 188Page 189->Page 190Page 191Page 192Page 193Page 194Page 195Page 196Page 197Page 198Page 199Page 200Page 201Page 202Page 210Page 220Page 230Page 240Page 250Page 260Page 270Page 280Page 290Page 300Page 310
|
|
 
|
 
|