Global Assessment Report on Disaster Risk Reduction 2015
Making development sustainable: The future of disaster risk management |
Global Assessment Report on Disaster Risk Reduction 2015
Making development sustainable: The future of disaster risk management |
|
|
57
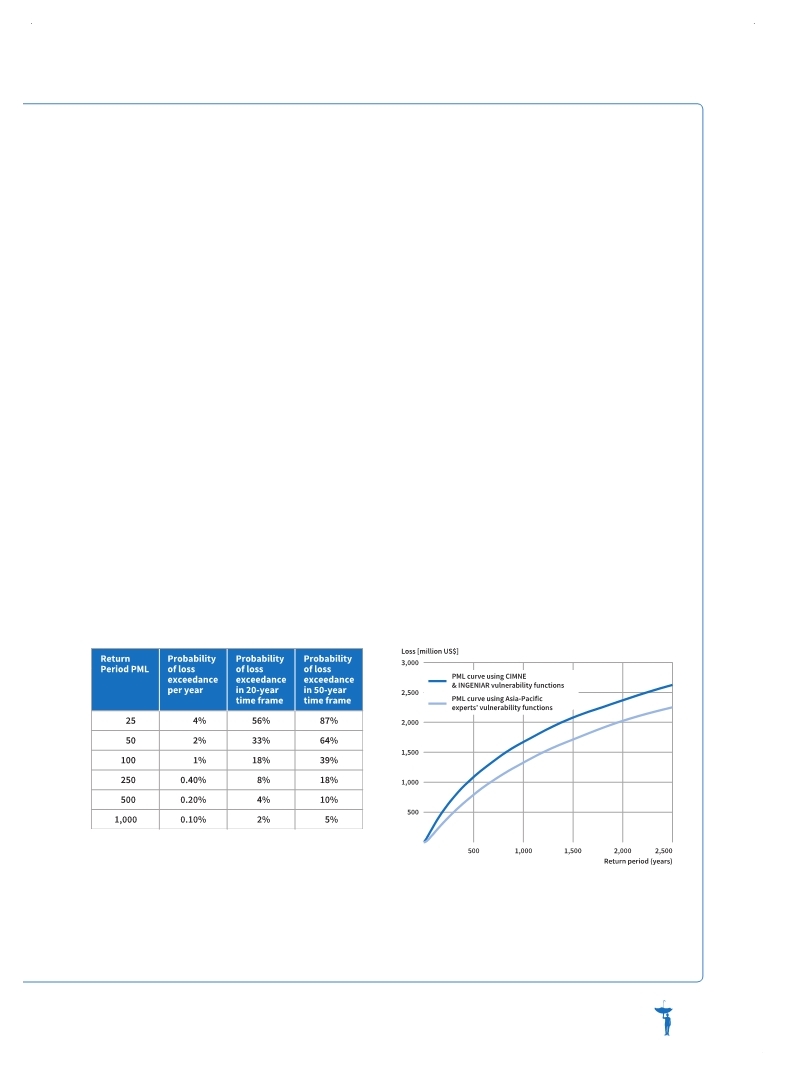
Table 3.1 Probabilities for different return periods
Figure 3.3 Sensitivity of results to input data
(Source: UNISDR.)
(Source: CIMNE-INGENIAR, 2014.)
Probability refers to the frequency of occurrence or the return period of losses associated with hazardous events. The concept of return period is often misunderstood. If a loss has a 500-year return period, this does not mean that the loss occurs every 500 years. If the loss occurred today, it does not mean that it will not recur for another 500 years. What it really means is that on average it occurs once every 500 years.
For example, if there were records of losses of different intensities over 1,000 years (Figure 3.2), it can be seen that nine losses exceeded an intensity of 60 over that period. The intervals between these losses fluctuate between 60 and 200 years. However, losses of an intensity of 60 were exceeded every 100 years on average, and that is the return period. Expressed in a different way, the annual probability of a loss exceeding an intensity of 60 is 0.1 per cent. The PML for different return periods can therefore be expressed as the probability of a given loss amount being exceeded over different periods of time (Table 3.1). Thus, even in the case of a thousand-year return period, there is still a 5 per cent probability of a PML being exceeded over a 50-year time frame. This metric is relevant, for example, to the planners and designers of infrastructure projects, where investments may be made for an expected lifespan of 50 years. In the development of risk models, many different data sets are used as input components. The level of uncertainty is directly linked to the quality of the input data. On many occasions during model development, expert judgment and proxies are used in the absence of empirical data, and the results are very sensitive to most of these assumptions and variations in input data. As such, all the AAL and PML figures presented in this chapter should be considered indicators of the order of magnitude of the risks, not as exact values. For example, PML curves developed with the same hazard and exposure models change when different vulnerability functions are used, although the order of magnitude remains the same (Figure 3.3). Better data quality and advances in science and modelling methodologies reduce the level of uncertainty, but it is crucial to interpret the results of any risk assessment against the backdrop of unavoidable uncertainty. |
 
Page 1Page 10Page 20Page 30Page 40Page 47Page 48Page 49Page 50Page 51Page 52Page 53Page 54Page 55Page 56Page 57Page 58->Page 59Page 60Page 61Page 62Page 63Page 64Page 65Page 66Page 67Page 68Page 69Page 70Page 71Page 80Page 90Page 100Page 110Page 120Page 130Page 140Page 150Page 160Page 170Page 180Page 190Page 200Page 210Page 220Page 230Page 240Page 250Page 260Page 270Page 280Page 290Page 300Page 310
|
|
 
|
 
|