Disaster losses & statistics
While absolute economic losses are concentrated in high-income countries, the human cost of disasters falls overwhelmingly on low and middle-income countries.
2023 snapshot
- US$ 250 billion in overall losses (Munich Re)
- US$ 155 billion in uninsured losses (Munich Re)
- US$ 95 billion in insured losses (Munich Re)
- 399 recorded events (CRED)
- 86,473 deaths (CRED)
- 93.1 million people total affected (CRED)
*The figures do not represent biological disasters.
The invisible toll of disasters
The estimated insured losses from disasters are a staggering US $120 billion — but they represent just the tip of the iceberg.
| Figures | 2023 | 2022 | 2021 | 2020 | 2019 |
| Overall losses in US$ b (Munich Re) | 250 | 270 | 280 | 210 | 166 |
| Uninsured losses in US$ b (Munich Re) | 155 | 150 | 160 | 128 | 109 |
| Insured losses in US$ b (Munich Re) | 95 | 120 | 120 | 82 | 57 |
| Recorded events (CRED) | 399 | 387 | 407 | 380 | 505 |
| Deaths (CRED) | 86,473 | 30,704 | 18,274 | 17,664 | 27,199 |
| People affected in million (CRED) | 93.1 | 185 | 103.5 | 97.6 | 109.2 |
| People displaced by disasters in million (IDMC) | - | 8.7 | 23.7 | 7 | 24.9 |
| People in million living in acute food insecurity driven by weather extremes (FSIN) | 71.9 [18 countries affected] | 56.8 [12 countries affected] | 23.5 [8 countries] | 15.7 [15 countries] | 33.8 [25 countries] |
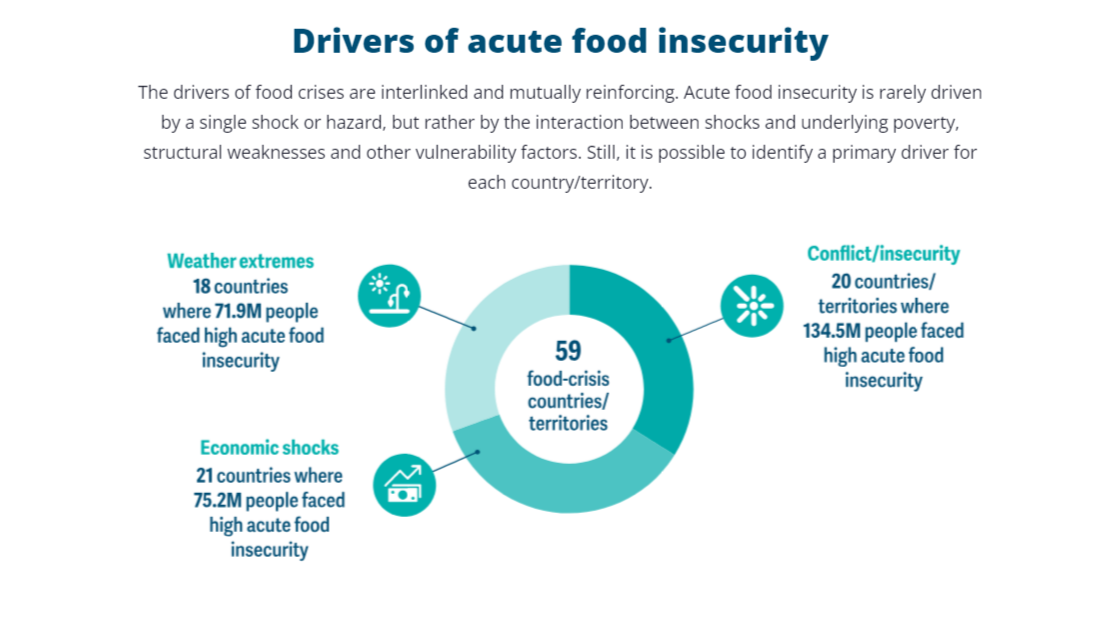
There has been a startling rise in acute food insecurity (in which lack of food poses an immediate threat to life and livelihoods) between 2020. While conflict and fragility have been a major driver of this trend, the number of people facing acute food insecurity has also risen sharply, more than doubling from 30 million in 2018 to nearly 72 million in 2023.
Over the last 30 years, an estimated USD 3.8 trillion worth of crops and livestock production has been lost as a result of disaster events, corresponding to an average loss of USD 123 billion per year or 5 percent of annual global agricultural GDP. Lower-income and lower-middle-income countries sustained the highest losses due to extreme events, up to 10 percent of their agricultural GDP. Losses in SIDS account for about 7 percent of their agricultural GDP (FAO, 2023).
14.9 million excess deaths were associated with the COVID-19 pandemic in 2020 and 2021. Excess mortality includes deaths associated with COVID-19 directly (due to the disease) or indirectly (due to the pandemic’s impact on health systems and society).
Yet, these reported losses only represent the tip of the iceberg."You cannot manage your disaster risk if you are not measuring your losses."- Mami Mizutori, UN Special Representative of the Secretary-General for Disaster Risk Reduction
Under-reported small-scale and slow-onset disasters
Tens of thousands of small-scale disasters occur each year throughout the world because of flooding, landslides, fires and storms. These events are not reported in international databases. Yet, their impact can be just as damaging as large disasters, causing death, injury and loss of livelihoods. An analysis of records in 104 countries found that between 2005 and 2017, small and medium, localized and frequent disasters caused 68% of all economic losses. These losses are a major driver of poverty as they tend to be absorbed by low-income households and communities, small businesses, and local and national governments.
Similarly, losses from slow-onset hazards such as droughts are not always fully accounted for. Their effect often accumulates slowly over an extended period and their impacts are difficult to measure. When slow-onset disasters are added to the Asia-Pacific region’s riskscape, annualized economic losses more than quadruple to USD $675 billion or around 2.4 percent of the region’s GDP (compared to previous estimates).
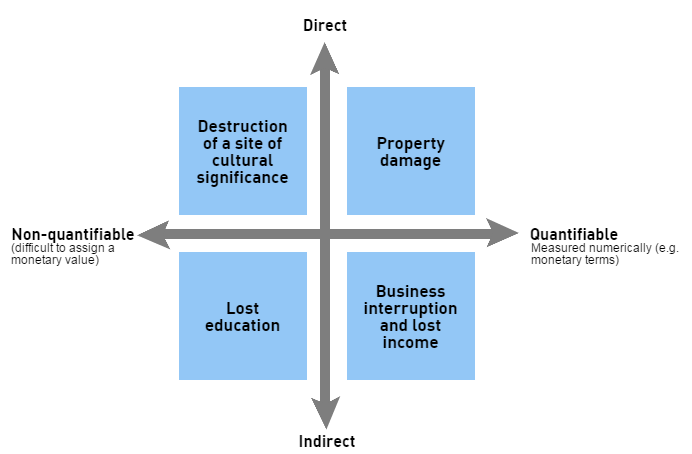
Indirect and intangible losses
Direct losses refer to the physical or structural impact caused by the disaster such as the destruction of infrastructure resulting from high winds, flooding or ground shaking. Indirect effects are the subsequent or secondary results of the initial destruction, such as business interruption losses. A full consideration of all direct, indirect, and intangible losses would produce much higher loss estimates than the more easily quantified and commonly seen records of direct loss.
Lost productivity
Severe disasters have lasting effects on productivity. Analysis from the World Bank finds that during 1960-2018, climate disasters reduced annual productivity by an average of 0.5 percent. After three years, severe climate disasters lower labor productivity by about 7 percent, mainly through weakened total factor productivity.
Severe biological disasters can also cause persistent damage to productivity. Four epidemics since 2000 (SARS, MERS, Ebola, and Zika) had significant and persistent negative effects on productivity. They lowered productivity by 4 percent after three years.
Supply chains disruptions
The impact of local disasters can also be felt across the global economy. After Hurricane Maria struck Puerto Rico in 2017, a major wholesale medical supply company in San Juan was unable to maintain production. As a result, hospitals across the United States faced a critical shortage and a 600% increase in the cost of intravenous bags.
Research has found that intensifying river floods caused by global warming will affect the European Union and the United States predominantly by indirect losses passed down along the global trade and supply network. In the US, In the US, direct losses from riverine floods are expected to be around 30 billion US dollars, whereas indirect losses could reach 170 billion US dollars in the next 20 years.https://www.youtube.com/embed/rhjs4O_I8gY
Lost investment
Disasters also divert funding from investments to finance the rebuilding costs. To really understand the economic costs of a disaster, growth accounting considers the productive use of capital and innovation. In the US for instance, hurricanes caused $306 billion in damages in 2017 and $91 billion in 2018. As a result, productive investment fell about $400 billion in total in those years.
Mental health
Disasters can also impact mental health. People whose homes are damaged by storms or flooding are significantly more likely to experience mental health issues such as depression and anxiety. In the UK, the estimated mental health cost from flooding events ranges from £1,878 to £4,136 per adult, depending on the magnitude of the flood.
Lost education
Children and youth affected by disasters often miss school, owing to displacement, the destruction of facilities or the use of school buildings as temporary shelters. School closures not only undermine education, they also hamper the provision of essential services in vulnerable communities. The COVID-19 pandemic has caused the most severe disruption in the world’s education systems in history. According to UNESCO, nearly 1.6 billion learners in more than 190 countries, 94% of the world’s student population, were affected by the closure of educational institutions at the peak of the crisis.
Additional resources
Disaster statistics reports
Global Report on Internal Displacement (2020)
The Internal Displacement Monitoring Center's (IDMC) Global Report on Internal Displacement (GRID) is the official repository of data and analysis on internal displacement.
Internal Displacement Monitoring Centre (IDMC)
Global Report on Internal Displacement (2019)
This year’s Global Report on Internal Displacement highlights the many challenges, but also opportunities, that cities face today when dealing with internal displacement.
Norwegian Refugee Council, Internal Displacement Monitoring Centre (IDMC)

Global report on food crises - 2019
This information supports humanitarian and development actors to plan and fund evidence-based responses, while using the data to seek high-level political action for durable solutions to food crises.
World Food Programme, Food and Agriculture Organization of the United Nations - Headquarters, International Food Policy Research Institute, Food Security Information Network (FSIN)