Global Assessment Report on Disaster Risk Reduction 2015
Making development sustainable: The future of disaster risk management |
Global Assessment Report on Disaster Risk Reduction 2015
Making development sustainable: The future of disaster risk management |
|
|
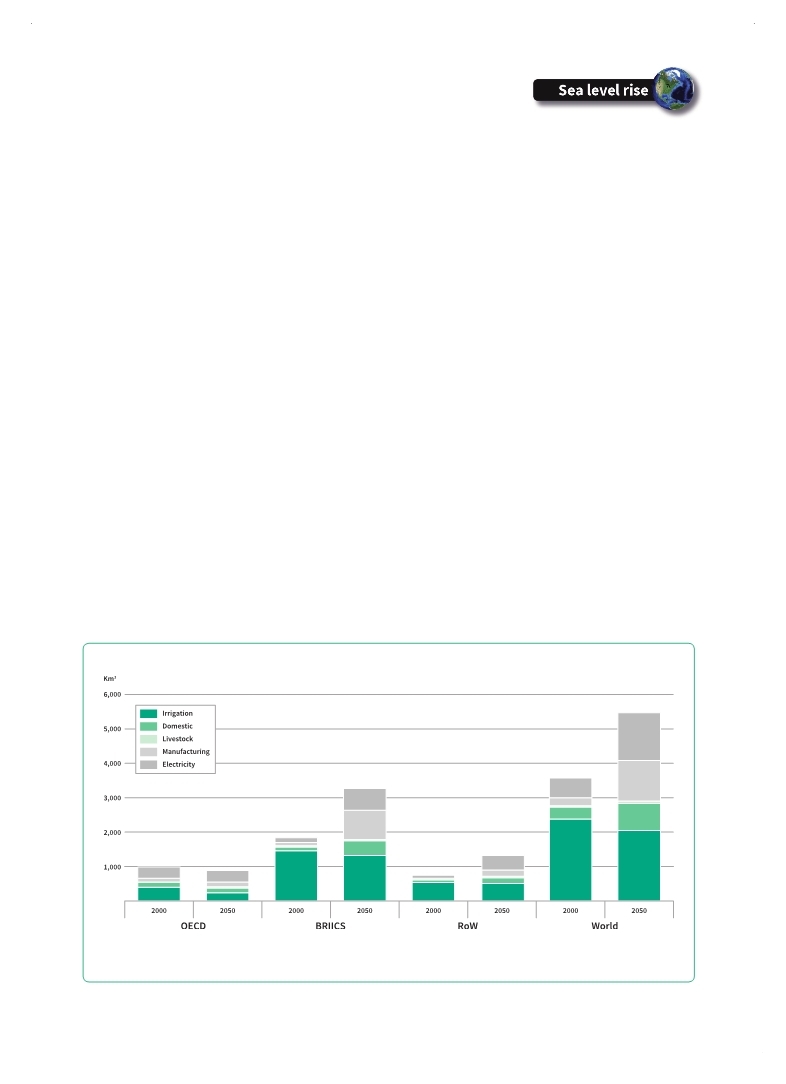
Note: BRIICS = Brazil, Russia, India, Indonesia, China, South Africa. RoW = Rest of the world.
242
Part III - Chapter 12
Energy generation, and therefore consumption, also contribute to the depletion of natural resources such as water. Global water demand will increase dramatically even if agricultural production practices become more water-efficient (OECD, 2012
OECD (Organisation for Economic Co-operation and Development). 2012,OECD Environmental Outlook to 2050: The consequences of Inaction, Paris: OECD Publishing.. . By 2050, it is estimated that 40 per cent of the global population will be living in river basins that experience severe water stress, particularly in Africa and Asia (Figure 12.12). Groundwater depletion is projected to become a severe challenge for agriculture and urban water supplies, and though water supply should improve overall, it appears likely that more than 240 million people will not have access to drinking water by 2050 (OECD, 2012
OECD (Organisation for Economic Co-operation and Development). 2012,OECD Environmental Outlook to 2050: The consequences of Inaction, Paris: OECD Publishing.. . Current projections show that the speed and scale at which ecosystem decline could proceed,
not least due to sea level rise, may render existing efforts to manage disaster risk insufficient and ineffective. For example, the global reduction of wetland areas—an estimated 50 per cent since the beginning of the twentieth century—will lead to a severe reduction in global and especially local capacity to absorb water during floods and to reduce peak flows (TEEB, 2013
TEEB (The Economics of Ecosystems and Biodiversity). 2013,The Economics of Ecosystems and Biodiversity for Water and Wetlands. . Coleman, James, Oscar Huh and DeWitt Braud, Jr. 2008,Wetland Loss in World Deltas, Coastal Studies Institute, Louisiana State University. Available from http://www.geol.lsu.edu/WDD/ PUBLICATIONS/CH&B04/wetland_loss.htm Accessed 08 December 2014.. . The cost of lost wetlands due to damage from lack of storm protection is potentially significant. In the United States, the cost of losing 1
Figure 12.11 Global water demand by 2050
(Source: OECD, 2012
OECD (Organisation for Economic Co-operation and Development). 2012,OECD Environmental Outlook to 2050: The consequences of Inaction, Paris: OECD Publishing.. . |
 
Page 1Page 10Page 20Page 30Page 40Page 50Page 60Page 70Page 80Page 90Page 100Page 110Page 120Page 130Page 140Page 150Page 160Page 170Page 180Page 190Page 200Page 210Page 220Page 230Page 232Page 233Page 234Page 235Page 236Page 237Page 238Page 239Page 240Page 241Page 242Page 243->Page 244Page 245Page 246Page 247Page 248Page 249Page 250Page 251Page 252Page 253Page 254Page 255Page 256Page 260Page 270Page 280Page 290Page 300Page 310
|
|
 
|
 
|