Global Assessment Report on Disaster Risk Reduction 2015
Making development sustainable: The future of disaster risk management |
Global Assessment Report on Disaster Risk Reduction 2015
Making development sustainable: The future of disaster risk management |
|
|
255
Thirdly, if disaster risk is driven into previously unknown orders of magnitude and into new domains, the ability to manage known risks will be only one pillar of effective risk management. Instead, the general agility required to manage risks as they emerge by anticipating, adapting and continuously transforming may be more important—particularly where it builds general as opposed to specific resilience (
 Pelling, 2014 Pelling, 2014 Pelling, Mark (ed.). 2014,Pathways for Transformation: Disaster risk management to enhance development goals, Background Paper prepared for the 2015 Global Assessment Report on Disaster Risk Reduction. Geneva, Switzerland: UNISDR.. Pelling, Mark (ed.). 2014,Pathways for Transformation: Disaster risk management to enhance development goals, Background Paper prepared for the 2015 Global Assessment Report on Disaster Risk Reduction. Geneva, Switzerland: UNISDR.. Click here to view this GAR paper. Cavallo and Ireland, 2014 Cavallo, Antonella and Vernon Ireland. 2014,Preparing for Complex Independent Risks: A System of Systems Approach to Building Disaster Resilience, Input Paper prepared for the 2015 Global Assessment Report on Disaster Risk Reduction. Geneva, Switzerland: UNISDR.. Click here to view this GAR paper. The concept of social progress is useful as it incorporates many of the characteristics that
will be required to manage risks effectively: basic human needs, foundations of well-being, and opportunity.5
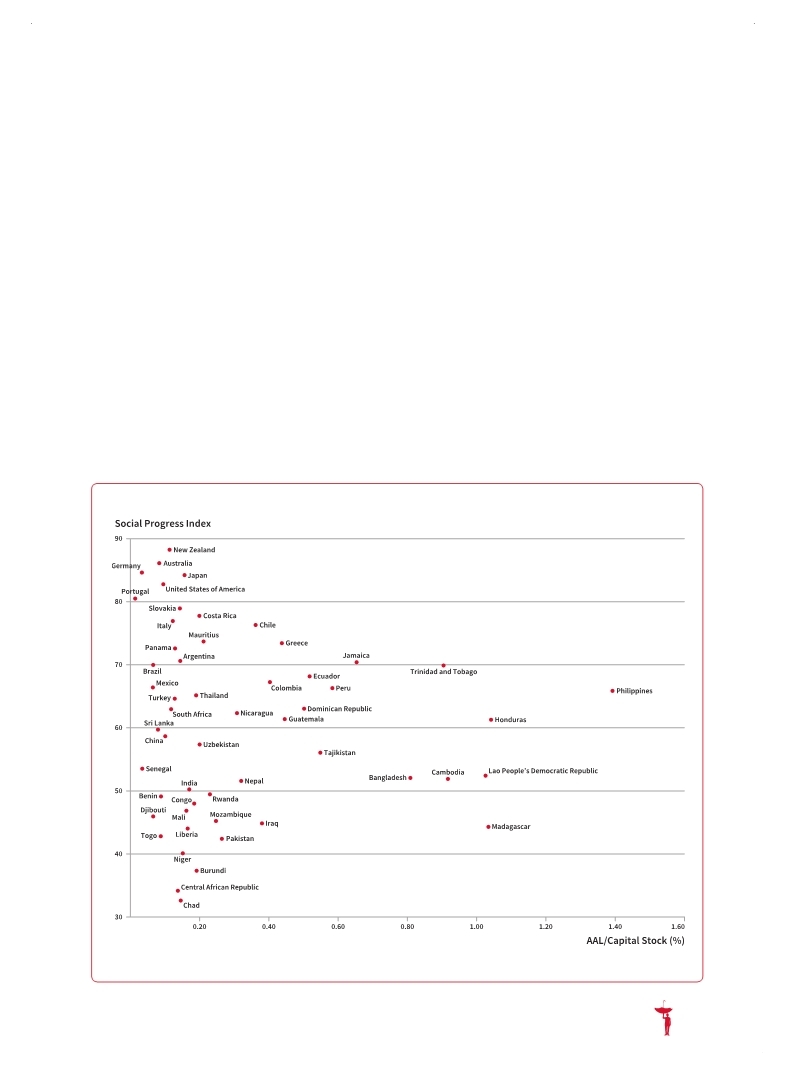
As such, countries that score highly on the Social Progress Index are likely to have greater capacity to manage and reduce their disaster risks. This is important because it implies that sound disaster risk management is not only a prerogative of high-income countries, but rather of all countries that have achieved a certain level of social progress. For example, while Mauritius and Iraq exhibit very similar levels of disaster risk, Mauritius has attained a far higher level of social progress and is therefore better positioned to manage its risks (Figure 13.4).
Figure 13.4 Social progress and average annual loss
(Source: UNISDR with data from Global Risk Assessment and the Social Progress Index.)
|
 
Page 1Page 10Page 20Page 30Page 40Page 50Page 60Page 70Page 80Page 90Page 100Page 110Page 120Page 130Page 140Page 150Page 160Page 170Page 180Page 190Page 200Page 210Page 220Page 230Page 240Page 245Page 246Page 247Page 248Page 249Page 250Page 251Page 252Page 253Page 254Page 255Page 256->Page 257Page 258Page 259Page 260Page 261Page 262Page 263Page 264Page 265Page 266Page 267Page 268Page 269Page 270Page 280Page 290Page 300Page 310
|
|
 
|
 
|