IPCC says Earth will reach temperature rise of about 1.5℃ in around a decade. But limiting any global warming is what matters most
Of all the troubling news in the Intergovernmental Panel on Climate Change (IPCC) report out on Monday, one warning will surely generate the most headlines: under all scenarios examined, Earth is likely to reach the crucial 1.5℃ warming limit in the early 2030s.
As the report makes clear, global warming of 1.5℃, and then 2℃, will be exceeded this century unless we make deep cuts to CO₂ and other greenhouse gas emissions in coming decades.
Climate change and its consequences are already being felt. Beyond 1.5℃, the situation is likely to rapidly deteriorate.
We are among the climate scientists who contributed to the latest IPCC report, including on the question of 1.5C℃ warming. Here, we go beyond the headlines to explain how the 1.5℃ rise is measured – and why maintaining the lowest global warming possible is what really matters.
‘The most important goal’
Under the 2015 Paris Agreement, nations agreed to hold global warming to well below 2℃, and preferably limit it to 1.5℃, compared to pre-industrial levels.
The first global stocktake of that agreement will be held in 2023, to assess the world’s progress towards achieving its goals. That’s one of the reasons global warming levels are being so keenly watched right now.
The IPCC’s latest findings say 1.5℃ warming will be reached or exceeded in the early 2030s in all emissions scenarios considered – except the highest emissions scenario, for which the crossing could occur even earlier.
But not all hope is lost. In the very low emissions scenario considered in the report – known officially as “SSP1-1.9” – Earth reaches 1.5℃ warming for a few decades, but drops back below it by the end of the century.
This point is important. It’s still possible for Earth to keep below 1.5℃ global warming this century, if we rapidly cut emissions to net-zero. All other scenarios lead to further global warming once 1.5℃ is reached.
However, if maintaining 1.5℃ is not possible, the next goal should be to limit global warming to 1.6℃, then 1.7℃ and so on. Limiting warming to the lowest possible level is the most important goal. Every bit of warming we avoid will reduce the climate risks we face.
How 1.5℃ warming is measured
The declaration that Earth has reached 1.5℃ warming since the pre-industrial era will not be made after a single year, or a single location, passes that threshold.
The warming is measured as a global average over 20 years, to account for natural variability in the system.
Before global average temperatures officially reach 1.5℃ warming, we can expect quite a few years will exceed that limit. In fact, global temperatures exceeded 1.5℃ warming during individual months at the peak of the 2015-16 El Niño.
The industrial era – and associated greenhouse gas emissions – started in the 1700s. But there is almost no observed climate data on land outside Europe before the mid-19th century.
So, the period of 1850-1900 is used to approximate pre-industrial conditions. The IPCC estimates there was a likely temperature change of between -0.1 to +0.3℃ for the century or so before this where climate data is lacking.
According to the latest IPCC findings, Earth’s average temperature in the last decade was 1.09℃ warmer than the pre-industrial baseline. Obviously, this goes most of the way to 1.5℃ of warming. The IPCC says this warming is unequivocally the result of human influence.
The new science
Several innovations have helped inform the IPCC’s latest assessment. For the first time, the IPCC’s estimate of future global temperature change is based on three factors.
First are projections using new scenarios “Shared Socio-economic Pathways” or SSPs. Each pathway refers to different trajectories the world’s society and economy could take, and the emissions that would result.
A range of climate models – the result of much global scientific effort – is used to simulate climate change in response to each pathway.
Second, climate models are verified against observed climate data. Climate models are essential tools, but should always be used carefully. This grounding in observations was particularly needed with the latest round of climate models, to bring their results in line with other types of evidence.
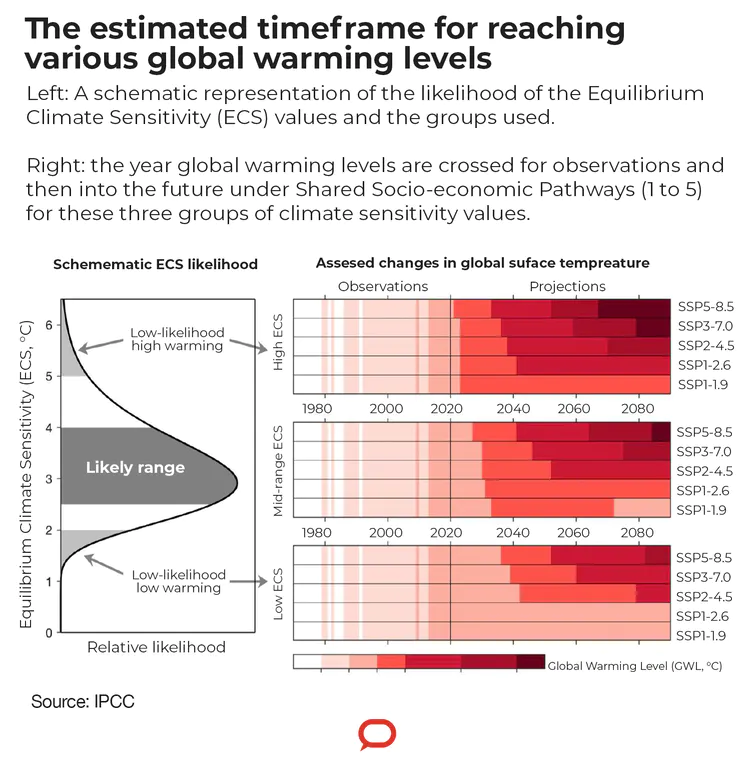
Third, the IPCC used an assessment of “climate sensititivty” – how sensitive Earth’s temperature is to a doubling of global CO₂ concentrations. The IPCC’s assessment of the evidence puts climate sensitivity at likely between 2.5℃ and 4℃, with low-likelihood possibilities of less than 2℃ or more than 5℃.
If humanity is lucky, and actual climate sensitivity is in the lowest plausible range, Earth may not reach the 1.5℃ warming limit under the lowest emissions scenarios (but still will under the medium or high ones). If we are unlucky and climate sensitivity is in the high range, the need to quickly reach net-zero emissions becomes even greater.
The following diagram from the latest IPCC report shows the estimated timeframe for reaching various global warming levels, under different Shared Socio-economic Pathways and climate sensitivity values.

Where does this leave us?
The latest IPCC findings confirm Earth will be in the ballpark of 1.5℃ warming in the early 2030s. What happens after that depends on the decisions we make today.
With deep and sustained reductions in CO₂ and other greenhouse gas emissions in coming decades, we could keep warming around the 1.5℃ mark and then bring it below that threshold by the end of the century.
The IPCC findings are worrying, but should not be a distraction from our global climate efforts. Staying below 1.5℃ warming is important. But maintaining the lowest global warming we can – whether or not we exceed the 1.5℃ goal – is what really matters.
To explore climate change in your region and around the world at 1.5℃ and higher global warming levels, see the IPCC’s Interactive Atlas.
![]()