USA: $24 billion national flood insurance program debt explained in one chart
By Kathleen Schaefer
As we are enter another hurricane season, the National Flood Insurance Program (NFIP) is on its 12th short-term extension since September 30, 2017. And after having $16 billion in debt forgiven, it remains $24.6 billion in debt. Many people are asking, how did we get here? While “its complicated,” much can be explained by this graph from a research study.
How this graph explains the $24.6 billion debt, begins with the knowledge that the NFIP is essentially an In-Out Flood Game. FEMA is the referee. They oversee the Flood Insurance Rate Maps (FIRMs) that show the Special Flood Hazard Area (SFHA) or 100-year flood. The FIRMS show who is “in” the floodplain and must pay and who is “out” and freer of building and insurance requirements. Almost every community in America participates in this Flood Game. Communities that opt out they risk losing access to post-disaster aid. Many cities like Roseville and Sacramento respect the power of floods and embrace the Flood Game—actively participating in activities like the Community Rating System (CRS), saving their citizens hundreds of dollars each year. Other communities focus on short-term growth and commercial development built on ignoring or denying flood risks. Not wanting to restrict development or force their residents to purchase flood insurance, they view any action that increases the designated floodplain as a “loss”, regardless of how prudent the decision may be in the long term.
Hydrology estimates are critical in this Flood Game. The in-out boundaries can only be adopted by the community after designated experts agree on the 100-year discharge value. Clear, well-defined, stationary, in-out boundaries for the 100-year floodplain have a key role in keeping the players in the game. But hydrology involves uncertainties and is not well charaterized by a single number. So, once everyone has agreed on a boundary, there is great reluctance to change it—even with indisputable climate change.
With that housekeeping out of the way, on to explain the chart.
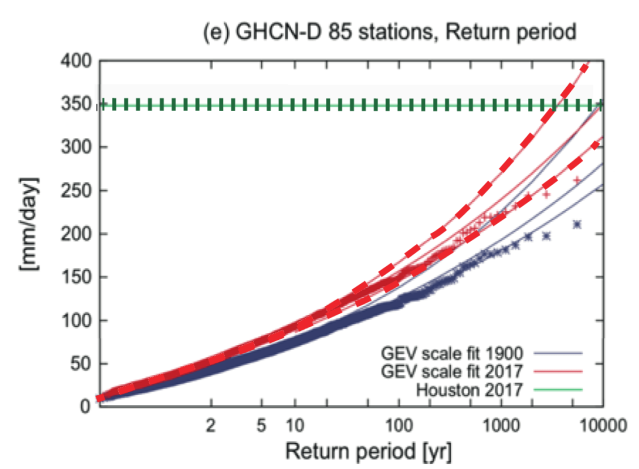
The chart’s Dutch researchers observed that extreme precipitation along the Texas Gulf Coast has increased 12% to 22% since observations began in 1880. To examine global warming’s contribution to the increase, they compared an ensemble of recorded precipitation gage data from the Gulf Coast to the output from global climate models, finding that the downscaled climate model data fit moderately well. The dotted horizontal line at 350 mm/day shows how extraordinary Hurricane Harvey was. It dropped more than 60 inches of rain and caused more an estimated $125 billion in damages. Harvey was an off-the-chart event. Rare extremes are possible.
The solid blue line is the annual maximum three-day average perception from 85 Gulf Coast precipitation gages scaled down to represent the rainfall distribution that would have been observed in 1900. The dashed red lines are the upper and lower estimates of the annual maximum three-day average perception estimated for 2017 conditions. The researchers concluded that global warming has increased the intensity of rainfall in the region by 15% over the last half-century. They suggest that these increases in extreme precipitation should be considered when rebuilding.
This graph also shows that precipitation at recurrence intervals greater than 100-year are possible. Larger return periods also have greater uncertainty. So precipitation estimates foundational to FEMA Flood Insurance Rate Maps are less certain than current in-out maps would lead one to believe.
Communities who play the Flood Game with reluctance do not want complications from considering additional discharges or uncertainties than the single 100-discharge previously agreed to. However, armed with this graph, the Harris County Flood Control Agency and the City of Houston could have used this moment to justify a higher design discharge value as the hydrology number. But they did not.
Although NFIP ratepayers and the federal government must ultimately pay for these decisions, and FEMA encourages communities to submit updated hydrology estimates for approval and adoption (44 CFR 66.1), changing the hydrology opens the possibility of redrawing flood rules, maps, and regulatory susceptibility—a messy complicated affair few wish to tackle.
If Houston would have adopted a higher 100-year discharge number, they would have had to admit that FEMA maps are no longer current and that the in-out boundaries need to change. This would have forced more Houstonians to elevate their homes, whether they could afford to or not. It would force hundreds more to buy flood insurance, whether they could afford it or not. Further, as the adoption of FEMA maps is a long process, it would add uncertainty to rebuilding at a time when people want only to get on with rebuilding. Not wanting to be criticized for not taking action, the Houston City Council did increase freeboard requirements for the unfortunates designated as “in” (the SFHA). But, as much as 50% of the homes at high or moderate flood risk are in the perceived “flood free” zone, and by not adopting new hydrology the in-out boundary will remain the same and many will unknowingly rebuild unwisely (CoreLogic).
As a recent Public Media article highlights, once rebuilding is underway, it is hard to change course. Thus, the process repeats. Ultimately, Californians will be forced to continue to subsidize the poor development decisions of Houston and other areas for fear that if we do not, Houstonians will not come to our aid when our levees fail. As we have no business telling Houston how to develop, perhaps it is time to remove ourselves from this Faustian bargain, and develop our own modern comprehensive flood risk and insurance program—one that goes beyond the In-Out Flood Game and considers a range of flood events and their uncertainties.