Satellites support disaster response to storm-driven landslides
Extreme precipitation can trigger deadly landslides. Satellite-based tools provide regional perspectives on landslide hazards, help assess risks in near-real time, and guide emergency responses.
High winds and flooding storm surges driven by tropical cyclones cause some of the deadliest and most damaging weather-related conditions around the world. The rainfall that cyclones bring compounds these conditions and, in hilly or mountainous areas, can trigger landslides that cause even more widespread and devastating impacts. When extreme precipitation occurs over short time frames, hillslopes may become saturated and critically unstable. The most intense storms can trigger thousands of landslides in mountainous areas, as was dramatically illustrated in Puerto Rico in September 2017, when Hurricane Maria’s rains left the landscape scarred by roughly 40,000 landslides.
Locating landslides quickly helps authorities direct resources to where they are most needed to save people and critical infrastructure.
Before and during a major cyclone, disaster responders need information about where landslides are likely to occur. In the aftermath, locating landslides quickly helps authorities direct resources to where they are most needed to save people and critical infrastructure. However, this information is often unavailable during an event response or is presented only for small regions, constraining the effectiveness of response efforts.
Satellite data provide regional perspectives of landslide hazards from major cyclones. New satellite constellations (groups of satellites functioning together) can image most of the world every day, helping scientists to detect the locations of landslides as they occur. In addition, using satellite data to characterize extreme rainfall allows us to model where landslides might occur in near-real time.
Our research group at NASA is developing a range of tools to help prepare for and respond to landslide disasters. These tools include rapid landslide mapping as well as modeling at different timescales to help direct response activities soon after a tropical storm dissipates and inform decisionmaking throughout the disaster life cycle.
Recently, we supported the NASA Disasters Program to deliver experimental products during significant disasters. In late 2020, a pair of major hurricanes allowed us, for the first time, to combine and test all our research in response to real events in real time and to gain valuable feedback from end users about the efficacy and utility of the tools we are developing.
Eta, Iota Delivered a One-Two Punch
The busy 2020 Atlantic hurricane season gave rise to 30 named storms—the highest number on record—including 13 hurricanes. In late October, warm sea surface conditions in the Caribbean caused Tropical Storm Eta to intensify rapidly. Eta made landfall south of Puerto Cabezas, Nicaragua, as a category 4 hurricane on 3 November. The storm tracked west and then northeast over Honduras and Guatemala before it reentered the Caribbean Sea and continued northeast. The storm strengthened again before making further landfalls in Cuba and Florida. Intense rainfall led to catastrophic flooding and landslides throughout Central America, with Guatemala, Honduras, and Nicaragua facing the most severe impacts.
Eta and Iota were among the worst disasters to strike Central America in several decades. Combined, the two storms led to hundreds of landslide-related fatalities.
Less than a week after Eta dissipated, Tropical Storm Iota became the final named storm of the season on 13 November. Iota also strengthened rapidly, becoming a category 5 hurricane by 16 November. The storm weakened marginally to a category 4 storm prior to hitting Nicaragua on 17 November, but the location of landfall was only 25 kilometers south of where Eta had first landed. The combined damage from Eta and Iota has been estimated at over $8 billion, with Eta causing more than $6 billion in damage in Central America.
Landslides resulting from Hurricane Eta claimed lives in Costa Rica, Guatemala, Honduras, and Nicaragua. One particularly deadly landslide killed more than 100 people in the village of Queja, Guatemala. Hurricane Iota also triggered fatal landslides in Honduras and Nicaragua, and some of the storm’s outlying rainbands even triggered deadly landslides in Colombia. Combined, the two storms led to hundreds of landslide-related fatalities, and although not as deadly as Hurricane Mitch in 1998, Eta and Iota were among the worst disasters to strike Central America in several decades.
A Real-World Test for Models and Observations
The dire conditions from the storms prompted immediate disaster response and recovery (DRR) efforts across the affected regions by various national and international agencies. During these efforts, we provided partner agencies with the latest versions of our landslide tools, putting them into practice in real experimental settings. These tools fall into two categories: predictive models of landslide effects before and during events and rapid observations of landslide locations in the immediate aftermath.
The Landslide Hazard for Situational Awareness (LHASA) tool, first deployed in 2017, provides near-real-time nowcasts of locations where landslide hazards are elevated by comparing precipitation data from the Global Precipitation Measurement mission (GPM) from the past 7 days with long-term precipitation records and a global landslide susceptibility map [Kirschbaum and Stanley, 2018; Stanley and Kirschbaum, 2017].
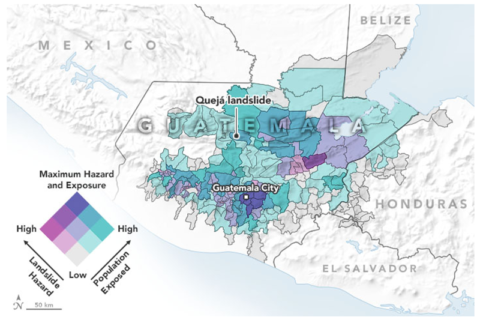 Fig. 1. This map illustrates results from the Landslide Hazard for Situational Awareness model, which assesses landslide hazard (purple shades) and population exposure to these landslide hazards (teal), during Tropical Storm Eta on 5 November 2020. Credit: NASA Earth Observatory
The latest version of the LHASA model uses a machine learning approach to estimate probabilistic landslide hazards around the world every 3 hours. We combine this hazard output with data sets detailing population and infrastructure to estimate landslide exposure—a critical step forward that allows stakeholders to make actionable decisions (Figure 1). Combining geophysical hazard science with socioeconomic data mirrors the shift in the broader natural hazards research community toward more interdisciplinary disaster research and is in line with the objectives of the United Nations’ Sendai Framework for Disaster Risk Reduction 2015–2030, which recognizes the increasing complexity of disasters and diversity of impacts on human systems.
During Eta and Iota, we also tested our landslide forecast product, which uses rainfall forecast data from the NASA Goddard Earth Observing System (GEOS) suite of computerized forecasts to model locations where intense rainfall is likely to trigger landslides in the coming days. Although this data product remains experimental, the landslide forecasts it produced for these hurricanes showed moderate and high levels of forecasted hazard in areas where landslides were reported or observed. We anticipate that this landslide forecast may address crucial needs of disaster response stakeholders prior to major rainfall events in the future.
Images of the Aftermath
As clouds clear after a cyclone, the full extent of the damage becomes clearer. Satellite radar data have been used to detect changes in topography due to landslides, even through clouds. However, optical imagery remains the most definitive source to determine landslide locations and effects on critical infrastructure like hospitals, power stations, and schools.
Our team recently developed a computerized method called Semi-Automatic Landslide Detection (SALaD) [Amatya et al., 2021], which uses 3-meter-resolution imagery from Planet Labs and 10-meter-resolution Sentinel satellite imagery to rapidly map landslides (Figure 2). Planet Labs’ satellites image much of the world once a day, meaning images can be obtained and landslides can be mapped almost as soon as clouds clear after an event.
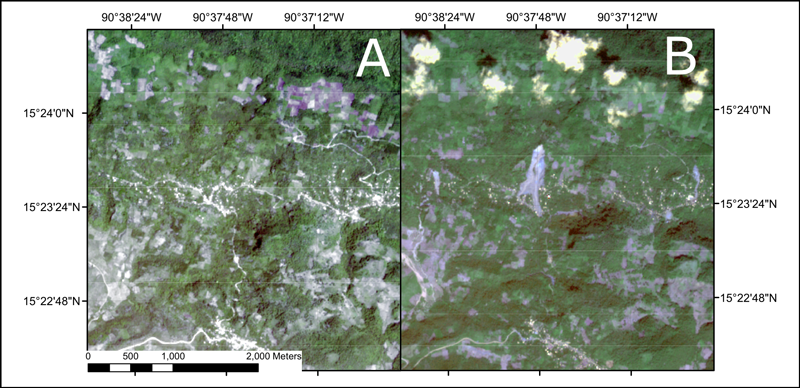
Fig. 2. These photos collected by the Sentinel-2 satellite highlight a major landslide event at Queja, Guatemala, triggered by Tropical Storm Eta. The site (a) before the landslide and (b) between Hurricanes Eta and Iota. Major landslide damage can be seen in the center of the image. Credit: Contains modified Copernicus Sentinel data 2020, processed by the European Space Agency
Using the hazard model results obtained from LHASA in conjunction with media reports, we can home in on regions of interest quickly to find areas most affected by landslides and identify where landslide mapping would be beneficial—in some cases within 2 days. This identification and mapping can help estimate impacts on rural communities that have been cut off from outside communication. In addition, landslide mapping guided by hazard estimates can help us discover landslides in unpopulated areas to provide more comprehensive regional maps of triggered landslides.
Information When It’s Needed
We were able to map landslides between the end of Hurricane Eta and before Iota made landfall, which allowed us to distinguish the effects of the two storms.
On the basis of informal discussions with disaster responders, the most critical time frame for disaster response information is within a week of an event. The rapid return periods of Planet Labs imagery allow us to build maps of landslide locations well within this time frame, providing information when it is most needed. Hurricanes Eta and Iota illustrated the value of this rapid response—we were able to map landslides even in the short cloud-free interval between the end of Hurricane Eta and the time before Iota made landfall, which allowed us to distinguish the effects of the two storms.
The purpose of developing the hazard and exposure estimates is to provide stakeholders with information to help support decisionmaking during major catastrophes, information that is especially valuable for remote regions and areas in which little information is available from the ground. During the two hurricane events last fall, we worked with the NASA Disasters team to help inform partner agencies assisting in DRR efforts in the region about potential landslide impacts. Our partners included the U.S. Department of Defense Southern Command (SOUTHCOM), the intergovernmental Coordination Center for the Prevention of Disasters in Central America and the Dominican Republic (CEPREDENAC), and the Pacific Disaster Center (PDC), an applied research center managed by the University of Hawaii.
This was the first time that each of the data products described above was provided to end users to support disaster response during an event. Some of the new users from CEPREDENAC and SOUTHCOM indicated that they valued having the regional perspective on landslide hazard and exposure provided by the tools. In particular, they emphasized that combining exposure information with hazard assessments helped them to prioritize the distribution of resources during their responses. In addition, users stated that the landslide forecast information may be the most useful tool for future events.
Field testing of our research is the best way to learn quickly what tools provide actionable information at relevant timescales and where additional work is needed. And with each test, we can incorporate feedback iteratively to keep improving the tools and guiding future developments.
More work is needed to ensure that all relevant hazard and exposure information reaches authorities and the public in areas at high risk of cyclone-driven landslides. However, we suggest that the combined suite of products described here can serve decisionmakers, especially those facing a dearth of detailed information from local observations, as valuable tools of triage in determining where emergency response is needed.