XDI releases world-first comparison of every state’s physical climate risk
The engine rooms of the global economy are among states and provinces most at risk from climate change and extreme weather according to a new ranking of the physical climate risk of every state, province and territory in the world released today by XDI (The Cross Dependency Initiative) – a world leader in physical climate risk analysis.
XDI’s Gross Domestic Climate Risk ranks over 2,600 jurisdictions around the world in 2050 according to modelled projections of damage to the built environment from extreme weather and climate change including from flooding, forest fires and sea level rise. It also identifies which of these jurisdictions see the greatest escalation of modelled damage from 1990 to 2050.
The results show that globally-significant states and provinces in China and the United States will be hit hardest, along with major cities and centres of economic activity around the world.
“This is the first time there has been a physical climate risk analysis focused exclusively on the built environment, comparing every state, province and territory in the world. Since extensive built infrastructure generally overlaps with high levels of economic activity and capital value it is imperative that the physical risk of climate change is appropriately understood and priced.”
The XDI Gross Domestic Climate Risk comparison of physical climate risk for 2050 found:
- Two of China’s largest sub-national economies – Jiangsu and Shandong – top the global ranking, in first and second place. Over half of the provinces in the global top 50 are in China.
- After China, the US has the most high-risk states with 18 states in the top 100. Florida is the highest-ranking US state, followed by California and Texas.
- Together, China, India and the US make up over half the states and provinces in the top 100.
- Other highly-developed and globally-significant economic hubs in the top 100 include Buenos Aires, São Paolo, Jakarta, Beijing, Hồ Chí Minh City, Taiwan and Mumbai.
- Australia, Belgium, Italy, Canada and Germany also have states and provinces in the top 100.
- South East Asia experiences the greatest escalation in damage from 1990 to 2050 anywhere in the world.
- Globally, most damage is caused by riverine and surface flooding or flooding combined with coastal inundation.
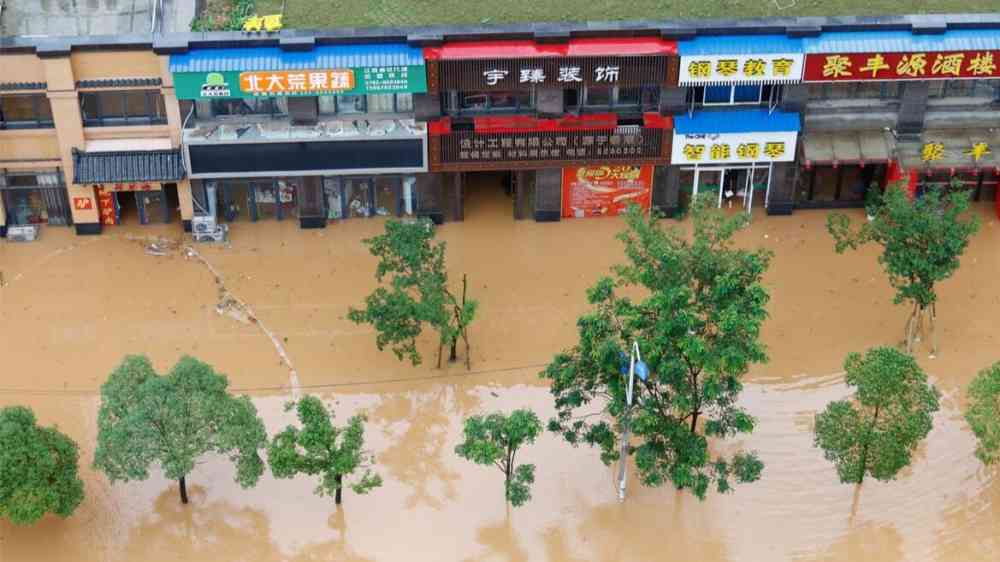
The financial cost of extreme weather and climate change is already being felt by many of the economies topping the XDI Gross Domestic Climate Risk ranking. In June 2022, extreme flooding in Guangdong, which ranks fourth in the analysis, caused an estimated 7.5 billion yuan in direct economic losses (over $1b USD). Hurricane Ian, which struck densely-populated parts of Florida in late September 2022, caused an estimated $67 billion in insured losses. Projections are for extreme weather events in regions like these to intensify in the coming years. Guangzhou, the capital of Guangdong, has been estimated to be ‘the most economically vulnerable city in the world’ to sea level rise by 2050.
About the Gross Domestic Climate Risk ranking
The XDI Gross Domestic Climate Risk ranking reflects physical risk to the built environment from eight climate change extreme weather hazards: riverine and surface flooding, coastal inundation, extreme heat, forest fire, soil movement (drought-related), extreme wind and freeze thaw.
The ranking is based on a data pool representing the built environment of the terrestrial world, with an asset level, bottom-up analysis using over 320 million data points. Global climate models, combined with local weather and environmental data and engineering archetypes calculate the likely damage to and failure of features of the built environment from hazards over time under the IPCC’s Representative Concentration Pathway (RCP) 8.5.
The territories presented in the XDI Gross Domestic Climate Risk dataset are the first sub-national administrative jurisdiction for most countries.