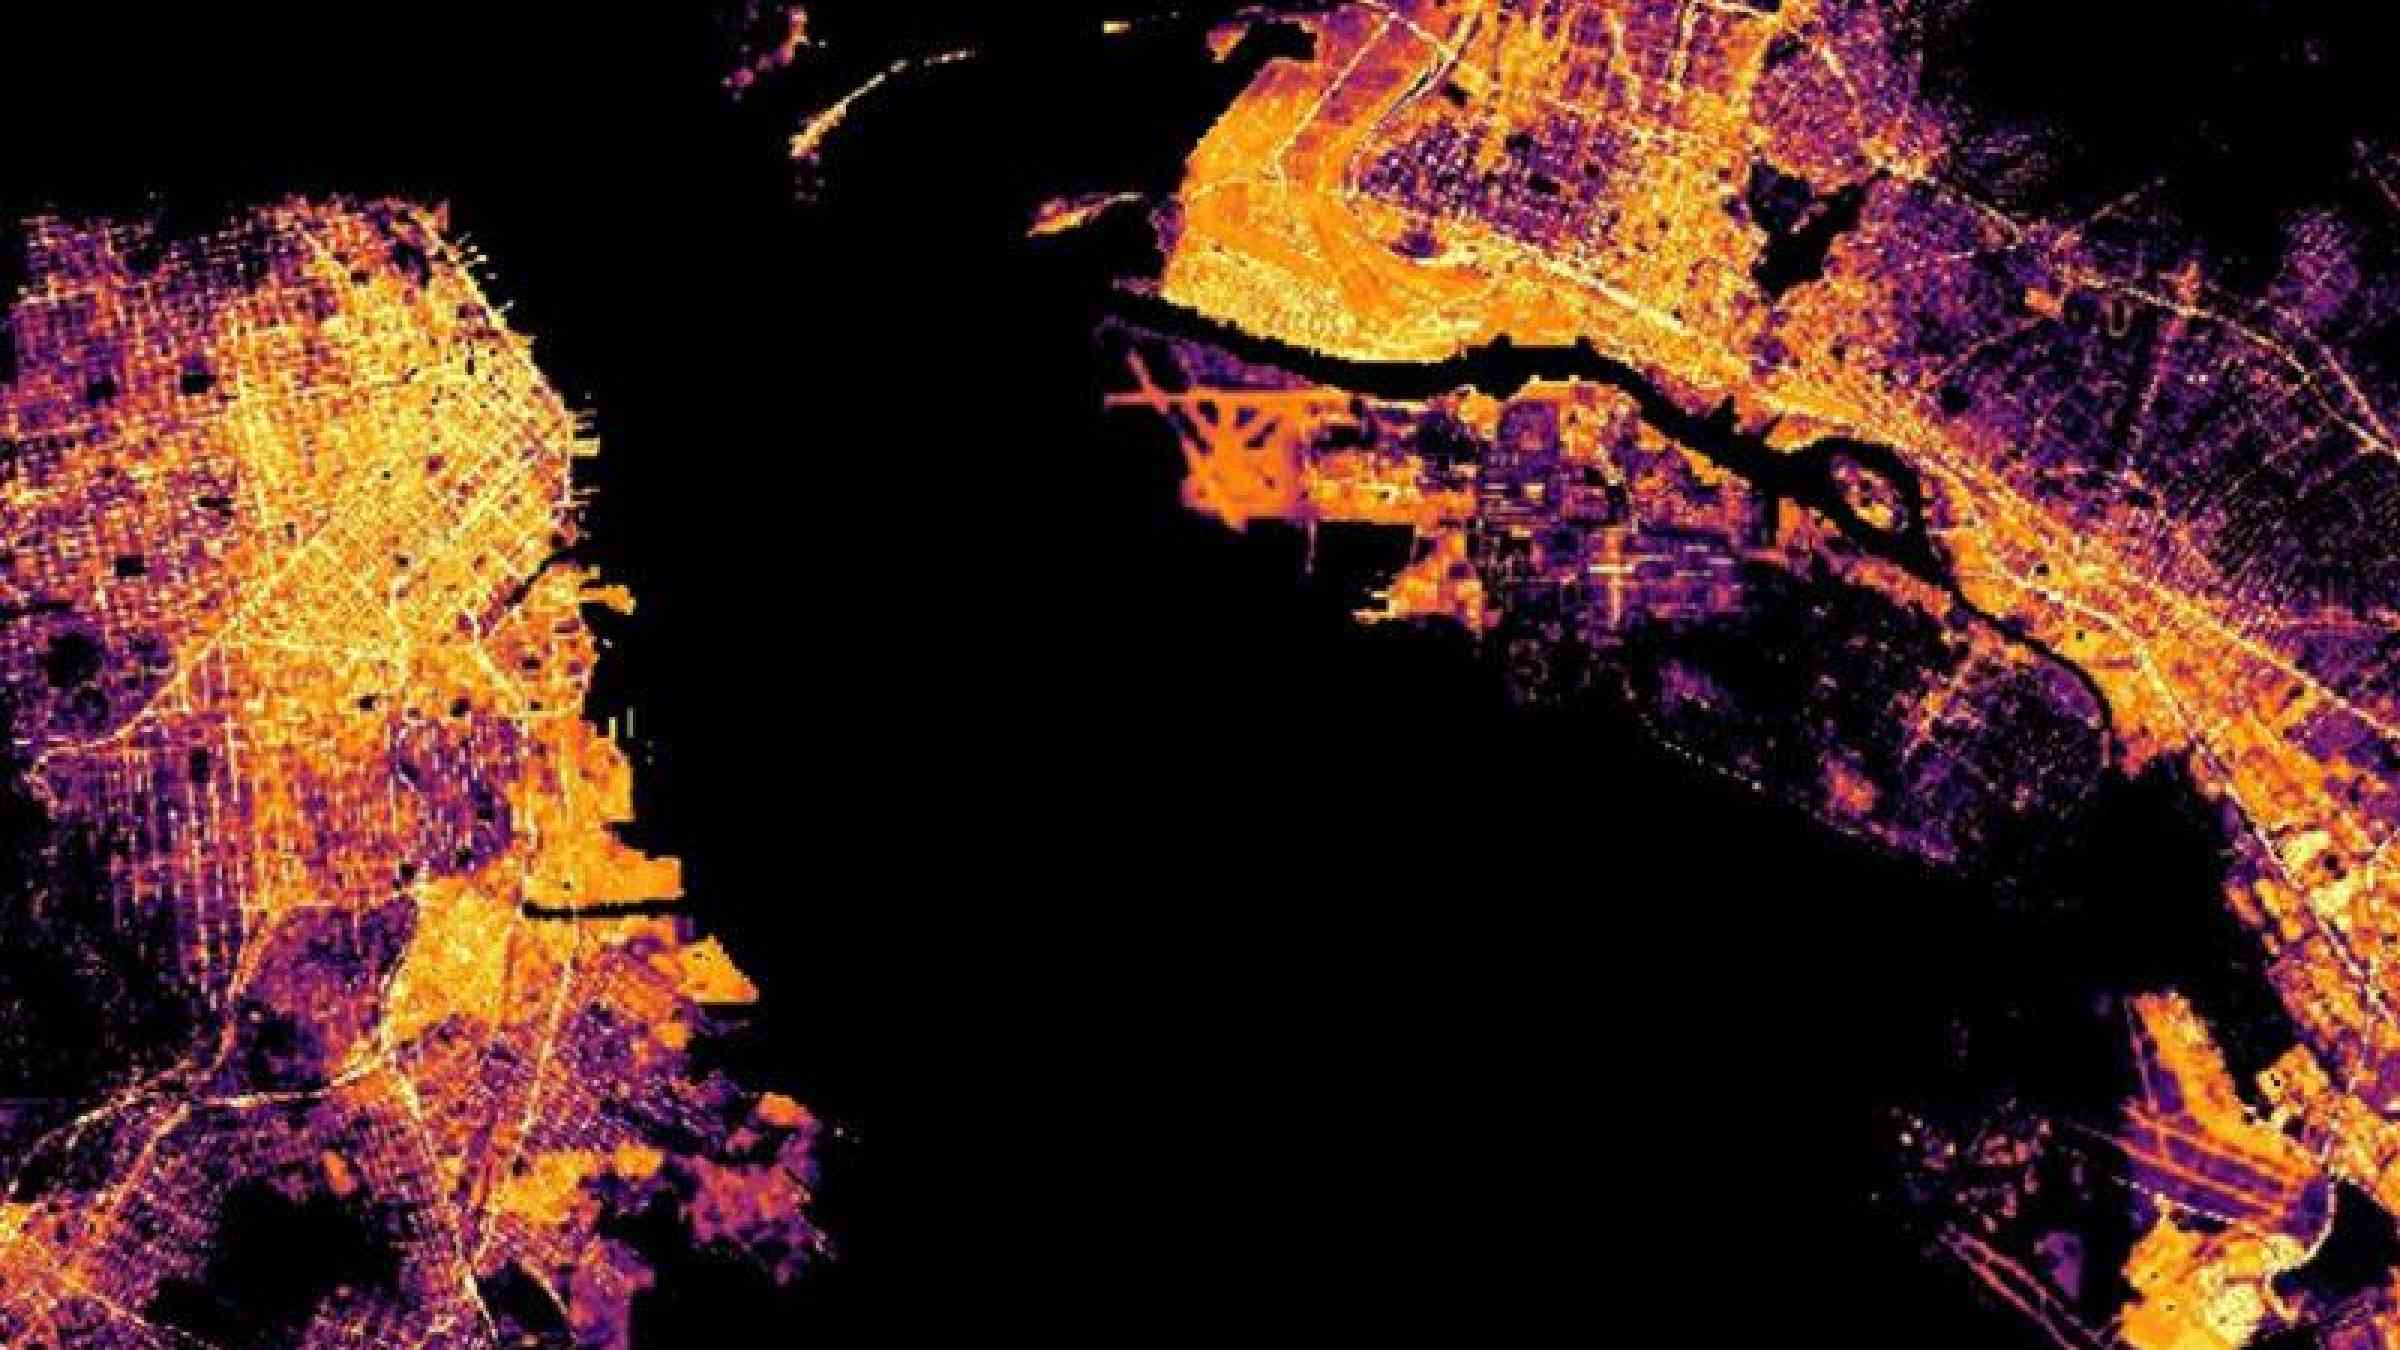
Restrictions on restaurants, theaters, and other businesses in response to the COVID-19 pandemic produced a visible change in nighttime lighting in large metropolitan areas. This photo from the NASA-NOAA Suomi National Polar-orbiting Partnership (NPP) satellite shows the San Francisco Bay area in June 2020. Integrating data from Earth observations with public health data could yield important insights into the ways that humans and their environments affect each other.
By Zhong Liu, Daniel Tong, Jennifer Wei, and David Meyer
Since early 2020, the COVID-19 pandemic and the widely adopted policies it has motivated, such as quarantining, lockdowns, and social distancing, have dramatically changed human behaviors and activities around the world and across many sectors, from transportation and shipping to manufacturing, education, and recreation. These behavioral changes have, in turn, affected Earth’s environment, alleviating air and water pollution in some places, for example.
Integrating satellite environmental data with data from multiple on-the-ground sources can provide a more holistic look at disease outbreaks as well as effects of outbreaks on the environment and society.
To help reveal the pandemic’s impacts on economies and people’s daily lives at local, regional, and global scales around the world, scientists, policymakers, and the public have looked to information from many different sources, including various public health and population data sets as well as in situ and satellite observations of environmental conditions. Satellite data typically cover wider areas than in situ observations; in situ observations are better at identifying small-scale phenomena, and they provide ground truth for satellite observations. Thus, integrating satellite environmental data with data from multiple on-the-ground sources can provide a more holistic look at the causes and spread of disease outbreaks, as well as the effects these outbreaks have on the environment and society.
Assembling all this information into forms that allow researchers to uncover links between health and environmental factors and that decisionmakers can use to enact effective policies is far from simple. Nonetheless, this sort of geohealth data integration is crucial in facilitating research and the search for solutions during public health crises like disease outbreaks, which are often influenced by environmental conditions. This point has been demonstrated not only during the ongoing COVID-19 pandemic but also by studies of other disease outbreaks in the past.
Here we discuss the need for effective integration of data from different disciplines (e.g., health, geosciences, economy, population) and sources (satellite versus on the ground), barriers to such integration, and tools and opportunities to overcome these barriers.
Satellites Provide a Big-Picture View
NASA launched the first weather satellite in 1960 and has since freely distributed a vast amount of weather data to research and application communities around the world. Over the past several decades, satellite-based measurements have been extended from weather to many other disciplines.
Today, satellite observations play important roles in providing environmental information of all sorts, including atmospheric chemistry, terrestrial and marine biology, and wildfire and volcano monitoring, among many others [e.g., Anenberg et al., 2020]. Satellite data also provide input for numerical models that optimally combine theory with observations (an approach known as data assimilation) to generate novel, continuous data sets for environmental and climate research and applications.
Without including data about the direct effects of COVID-19, it is difficult to make connections between environmental indicators and pandemic statistics.
In addition to Earth’s environment and climate, satellite observations have become vital for studying, monitoring, and predicting public health around the world. For example, the Earth Observing Dashboard (Figure 1) was developed by NASA, the European Space Agency, and the Japan Aerospace Exploration Agency in response to the COVID-19 pandemic. This dashboard gathers satellite data and provides information on air and water quality, population movements and activities, and other factors relevant to the pandemic.
A large number of indicators—agriculture productivity, nighttime light, and nitrogen dioxide and carbon dioxide levels, for instance—have been developed and are available via the Earth Observing Dashboard for tracing the impacts of the pandemic. However, without including data about the direct effects of COVID-19, such as daily, weekly, and monthly tallies of new cases, in time series or map overlays and analyses, it is difficult to make connections between environmental indicators and pandemic statistics.

Pandemic case information is available from sources such as Johns Hopkins University’s (JHU) COVID-19 dashboard, but extracting the necessary information to look for connections with environmental conditions can be tricky for people unfamiliar with public health databases. Likewise, scientists outside the remote sensing community can similarly have difficulty accessing satellite data for environmental information suitable for their studies.
Thus, there is a substantial need for tools and platforms that allow researchers to access and analyze disparate environmental and health data more seamlessly, despite a few ongoing projects. Although the current pandemic has greatly emphasized this point, previous disease outbreaks have already demonstrated the value of combining multidisciplinary data for geohealth studies.
Dust Storms and Valley Fever
The World Health Organization points out that disease outbreaks are often associated with environmental conditions. Recent studies in which we’ve been involved have borne out such an association, showing that spikes of valley fever in parts of the southwestern United States are connected with increasing dust storm activity in the region [Tong et al., 2017; Liu et al., 2018]. valley fever is caused by inhaling the soil‐dwelling fungi Coccidioides immitis and C. posadasii. Dust storms, which kick up soil into the air, increase human exposure to these fungi and thus promote valley fever outbreaks.
Tong et al. [2017] paired health data from the Centers for Disease Control and Prevention (CDC), the Arizona Department of Health Services, and the Pinal County Department of Public Health with environmental data from NOAA and NASA and continuous aerosol observations from the Interagency Monitoring of Protected Visual Environments monitoring network [Malm et al., 1994].

From the aerosol observations, they reported evidence of rapidly intensifying dust storm activity over southwestern U.S. deserts in recent decades (Figure 2). From the 1990s to the 2000s, the frequency of windblown dust storms increased 240%, a trend associated with large‐scale variations of Pacific sea surface temperature in the ocean related to the Pacific Decadal Oscillation. The team found that the frequency of dust storms correlates with elevated incidences of valley fever in two Arizona counties, Maricopa and Pima, where the disease is endemic.
Following up on the 2017 study, Liu et al. [2018] investigated the hydrometeorological conditions (winds, precipitation, soil moisture, atmospheric boundary stability, and land surface types) associated with increasing dust events in the southwestern United States during the same period. Their study showed that all of these conditions play important roles in dust events.
These studies exemplify how integrating environmental assessments with multidisciplinary data from public health organizations and other sources can lead to new insights about disease vectors and spread, and they support the need for useful data integration tools.
Challenges of Many-Sourced Data
Integrating environmental and health data presents many challenges. Even just among Earth observations, different data sets are typically discipline oriented and heterogeneous.
Integrating environmental and health data presents many challenges. First, even just among Earth observations, different data sets are typically discipline oriented and heterogeneous, having distinct formats and structures from one another.
Satellite data sets are designed so that each data file represents a snapshot or time average of environmental conditions in different dimensions with different spatial and temporal resolutions and coverage. Data structures—the ways the data are organized, processed, stored, and retrieved—are often complex, depending on the types of instruments, data providers, and projects involved. In situ measurement data, meanwhile, are often nonstructured: Photographs, video, and other formats, for example, are not easily reduced to numbers on a spreadsheet. The more such differences that exist among data sets, the harder it becomes to unify them and look for correlations.
Another complication is that complex data structures and large numbers of data files involved can make it challenging to extract long time series from environmental data sets for a given location. For example, the Integrated Multi-satellite Retrievals for Global Precipitation Measurement (IMERG) half-hourly precipitation data set contains more than 350,000 files [Huffman et al., 2019], each about 10 megabytes in size and spanning from 2000 to the present. Extracting a time series of precipitation at, say, a neighborhood in San Francisco from this data set would require a user to download all 350,000 files.
Health data relevant for disease outbreaks comprise clinical data, along with environmental, socioeconomic, and behavioral information pertinent to health and wellness. Like Earth observations, health data types are diverse and heterogeneous and can be structured or unstructured, further complicating integration efforts. In addition, health data are often not standardized, and records often reflect health conditions of individuals. Because few environmental data sets provide comparable degrees of street-level detail, drawing inferences that integrate health and environmental data can be difficult.
Overcoming Barriers Starts with Interoperability
Existing complications among distinct data sets—such as different standards, formats, and structures—require long-term continuous commitments and collaborations among data providers and stakeholders in the Earth science and health communities. Such collaborations may take years to develop and implement. In the meantime, advancing the abilities of various software packages to exchange data with each other (i.e., data interoperability) is a near-term solution to ensure that data from each community can be added seamlessly to existing software for analysis and integrated assessments.
Geographic information systems (GIS), for example, are often used to assess environmental data in geospatial frameworks, and health data are often organized by geographic regions. The COVID-19 data in JHU’s dashboard are organized by different political entities such as countries, states, counties, and zip codes. Thus, making Earth data available in a format (e.g., GeoTIFF) that GIS software can easily accept will improve data interoperability.
Tools developed through and used in NASA’s Earth Science Data and Information System (ESDIS) Project and the Goddard Earth Sciences Data and Information Services Center (GES DISC) are helping facilitate interoperability. For example, GeoTIFF is an ESDIS-approved standard data format for georeferenced images that is popular in the GIS community. This format is available for maps generated with Giovanni, a widely used online visualization and analysis tool for NASA satellite and model data developed by GES DISC.
With Giovanni, users can generate time-averaged temperature or time-accumulated rainfall maps, for example, and download the data in GeoTIFF. Giovanni also allows extraction of time series in comma-separated value (CSV) format from shapefiles (a vector data format used in GIS mapping). These time series are available for countries, U.S. states, major river basins around the world, and other similar services [Teng et al., 2016]. In addition, GeoTIFF is available through Web Map Services for many satellite-based gridded data sets covering hydrology, precipitation, atmospheric composition, and climate variability and housed at GES DISC. In recent years, utilizing cloud environments to provide Earth observation data services (e.g., Google Earth Engine) that are difficult to implement on premises has been a strategic vision in many organizations. Likewise, cloud-based data services including Giovanni are under development.
Health data can also be aggregated into gridded data sets, with variables mapped on uniform space-time grid scales, for example. These gridded data sets can thus be visualized and analyzed with existing tools in the Earth science community, such as Giovanni, offering health researchers a valuable means to compare their data with environmental data sets.
The Road to Transdisciplinarity
Interoperability is an important step in overcoming barriers to integrating health and Earth science data, but barriers to seamless and easy integration of disparate data remain.
The ongoing COVID-19 pandemic has shined a spotlight on challenges associated with analyzing different types of geohealth data. Combined, these data are key in studying and monitoring the impacts of the pandemic—and other public health concerns—on human activities and the environment around the world. Interoperability is an important step in overcoming barriers to integrating health and Earth science data, but barriers to seamless and easy integration of disparate data remain.
There are signs of progress, however. For example, cloud environments can provide not only centralized data storage to host an unprecedented amount of data from Earth, health, and other communities in one place [Ramachandran et al., 2020] but also opportunities to develop new capabilities for data access, analysis, and scientific reproducibility and to facilitate creation of a transdisciplinary data system to support research activity across all disciplines [e.g., Stember, 1991]. Going forward, data scientists and experts from various disciplines must collaborate closely to develop such a transdisciplinary system that everyone can use.