Innovative approaches for flood insurance affordability
People have been asking if Hurricane Ian will push the National Flood Insurance Program (NFIP) into an affordability crisis? Some argue the NFIP is already there.
Two weeks ago, the Greater New Orleans, Inc.’s Coalition for Sustainable Flood Insurance (CSFI) reported that NFIP’s new pricing strategy makes NFIP insurance premiums unaffordable. The report’s authors assert that increasing NFIP premiums and fees will lead to fewer households with flood insurance, and recommend slowing premium increases until an affordability program can be developed and funded. An examination of historical NFIP purchases by California households supports this assertion. We suggest a different affordability approach—a community-scale public/private partnership that makes insurance affordable by focusing on community resiliency and recovery.
The NFIP is the primary means for businesses, homeowners, and renters to insure for flood risk. The NFIP is the world’s largest single-peril insurance operation. Since 1978, the NFIP has paid over $72 billion in claims, helping approximately 2 million policyholders recover (Maurstad, 2021). A primary goal of the NFIP is to increase the number of households with flood insurance.
On October 1, 2021, FEMA implemented a new premium pricing method — Risk Rating 2.0 (RR2.0). Under RR2.0, the NFIP uses the same type of catastrophic loss modeling as private flood insurers. Under year one of RR2.0, FEMA estimated premiums would increase for 77% of current policyholders, some increasing as much as $240 per year. (FEMA 2018). The CSFI study estimates fully implemented RR2.0 increases in some areas of Texas and Florida could be $1009 to $3134 per year. A UC Davis estimate, covered in a previous California Water Blog, suggests that for California, changes from RR2.0 will be mixed.
FEMA asserts that RR2.0 is needed to make the program financially stable and to modernize setting premiums. The NFIP program was over $20 billion in debt even before Hurricane Ian. Program administrators also believe that premiums, based on actuarily sound rates, will help to communicate flood risk to the public and policyholders (Maurstad, 2021). While this may be true, as premium costs increase, the number of insured households decreases.
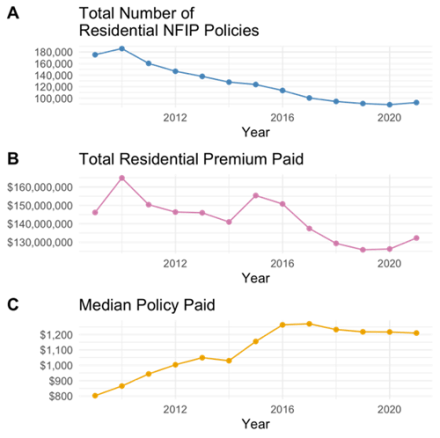
Nationally, the number of NFIP policies in force has declined from an all-time high in 2009 of 5.70 million policies in force to a low of 4.54 million by June 2022 (Insurance Information Institute 2021) as quoted in (CSFI 2022). In California, except for a spike in 2015, the number of NFIP policies has also steadily declined (Figure 1). The spike in policies correlates with Godzilla El Niño media stories in the major media markets. California’s Mediterranean climate oscillates between wet and dry winters (Swain et al., 2018). The sharp increase in policies suggests that some consumers respond to media reports of upcoming wet winters with a decision to buy flood insurance.

How does price affect insurance purchase decisions?
To evaluate the impact of price on buying habits of California households, NFIP purchase records were broken into full risk-rated and non-full risk-rated policies. Full risk-rated policies are generally required to be purchased by a lender and usually exceed $1000/year. Non-full risk-rated policies are grandfathered or preferred risk policies, and generally cost less than $600/year.
When the price and take-up rate data for full risk-rated policies (more expensive and generally mandatory purchases) are separated from those of non-full risk rated (cheaper, discretionary purchases), an interesting pattern emerges. When premiums exceed $1000 per year, the total premiums paid steadily decline (Figure 2). When premiums are less than $600 annually, the total premium paid increases (Figure 3). This suggests that keeping premiums below $600 per year would increase both premium income and the number of households protected by insurance (as well as the NFIP’s potential financial exposure).

Almost all studies of variables thought to affect insurance purchase decisions (e. g. price, personal beliefs, risk awareness, and income) have been for Texas, Florida, the Midwest or the Gulf Coast (Atreya, Ferreira, and Michel-Kerjan 2015; Michel-Kerjan, E., and Carolyn Kousky. 2010a; Browne, Mark J, and Robert E Hoyt 2000). California may be different. Our floods are primarily from atmospheric rivers, not hurricanes (Konrad & Dettinger 2017). California’s flood storage systems (e.g. Oroville, Shasta, and Folsom Dams) work in tandem with water storage systems. California has a Mediterranean climate that goes for months or sometimes years with no significant rainfall. And in the last 20 years, California has invested billions in upgrading and improving flood control infrastructure. These California characteristics can change flood risk and influence flood insurance purchasing decisions.
When the historical record of total non-risk rated premiums (cheaper discretionary policies) is broken into components. It shows many California households purchase flood insurance in the fall at the onset of expected wet weather. If the media alerts the public of an impending “Godzilla El Niño”, more homeowners respond by purchasing flood insurance. It also shows that when the seasonal trend and random effects are filtered out, aggregated premium payments show a clear upward trend.

This analysis suggests that if policies are priced around $600 or less, there is a willingness to buy. However, once the policy exceeds $600, homeowners are less willing or able to purchase flood insurance. For many California residents, this corresponds to a price of roughly one to two percent of the annual household income. Instead of creating a new bureaucracy to support subsidies and low-income grants, California might build public/private partnerships at the community level that deliver a base level of insurance to everyone for $600. Global reinsurers have expressed an interest in providing $100,000 to $300,000 of coverage to consumers in the SFHA for less than $600. A $100,000 policy would cover 85% of all NFIP historical claims payments in California.
While some reinsurers have expressed willingness to provide $100,000 worth of coverage for $600, getting to a price of $600 in some communities may mean that the community or the state may need to pick up the first layer of loss. This might take the form of a $10,000 recovery payment. A community-based resiliency and recovery program providing a $10,000 recovery payment that might be accepted as meeting the NFIP deductible would save residents 30-40% on an NFIP policy. It would also provide a financial incentive for communities to manage their flood risk proactively.
Getting to a price of $600 might also mean that the State might cover the top layer of risk, the risk greater than $100,000. The Paterno Decision showed that the state of California might ultimately have to pay should a State Plan of Flood Control Levee fail. A community-based insurance resiliency and recovery program provides a way for the state to manage this risk proactively. It would also provide a financial incentive for the State to continue to invest in flood management, even during times of drought.
A pilot community-based resiliency and recovery program has been initiated for Delta Legacy Communities. With the support of California and DWR, other pilot programs are being explored in the Central Valley and along the coast. The concepts of a community-based resiliency and recovery program, while still evolving, are the result of a multi-year collaboration with private industry, academia, the Department of Water Resources, and the Department of Insurance.
Conclusions
This analysis suggests several things. Expensive flood insurance is a poor tool to use to communicate flood risk. If premiums could be held to between 1 to 2% of the annual income, the NFIP would likely increase total premiums collected and increase the number of insured households. Focusing on reducing risk rather than establishing affordability plans is likely to be more successful. California has an opportunity to lead the nation in innovative insurance arrangements. In this, Public/Private/Community/Academic partnerships are critical to providing more affordable, accessible flood insurance.