How do La Niña and El Niño impact heat in a warming climate and what does this mean for heat hazard planners?

- More extreme heat must be anticipated in most world regions irrespective of the ENSO cycle. An eventual transition to an El Nino phase will amplify warming.
- Pre-existing regional drought will enhance heating cycles during heatwaves, and compound water scarcity, fire, smoke, and flash flood hazards.
- ENSO forecasts can only be used as a scenario planning tool to improve preparedness.
- Regional seasonal outlooks are the most informative guidance for planners as they focus on the most likely scenarios.
Extreme heat in 2023: What to expect if an El Niño is announced?
Climate scientists are discussing the prospect for a transition in the El Niño Southern Oscillation (ENSO) from the cooling conditions of La Niña to warming brought on by an El Niño in 2023i. How should that message be interpreted by extreme heat planners?
ENSO is one of the most important natural climate phenomena on Earth. It can change global atmospheric circulation, influencing temperature and precipitation around the globe. However, changes in ENSO can often be predicted many seasons in advance of its strongest impacts on weather and climate.1
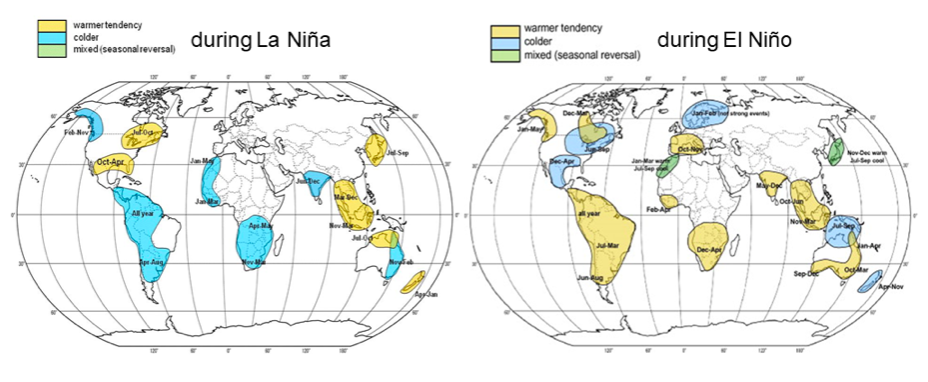
Figure 1 presents an analysis of the locations that have shown a tendency to experience warmer or cooler temperatures during La Niña and El Niño ENSO phases. These charts are not categorical forecasts. However, they can be interpreted as guides to the climatic conditions that can be expected. Those conditions can be bolstered or weakened by other regional climate influences, including the destabilizing influence of rising global temperatures.


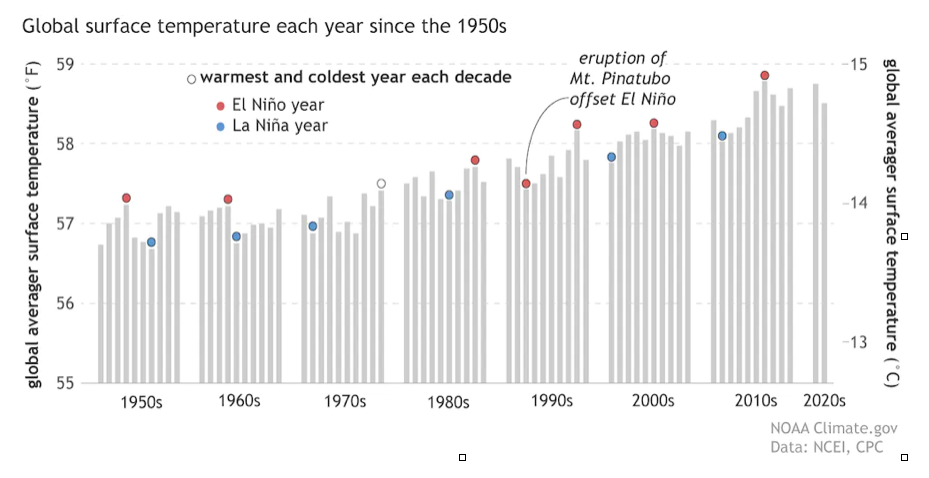
Figure 2 demonstrates that while La Niña is associated with, and contributes to, overall cooler global temperatures, those temperatures are gradually rising. Average global surface temperature during the most recent La Niñas (2020, 2021 and 2022) were higher than the warmer El Niño phases recorded before the 1990s.
The ENSO cycle in Figure 2 also shows that a relatively quick transition from La Niña to El Niño would slowly add additional warmth to global temperatures.
But what does this mean for heat hazard planners?
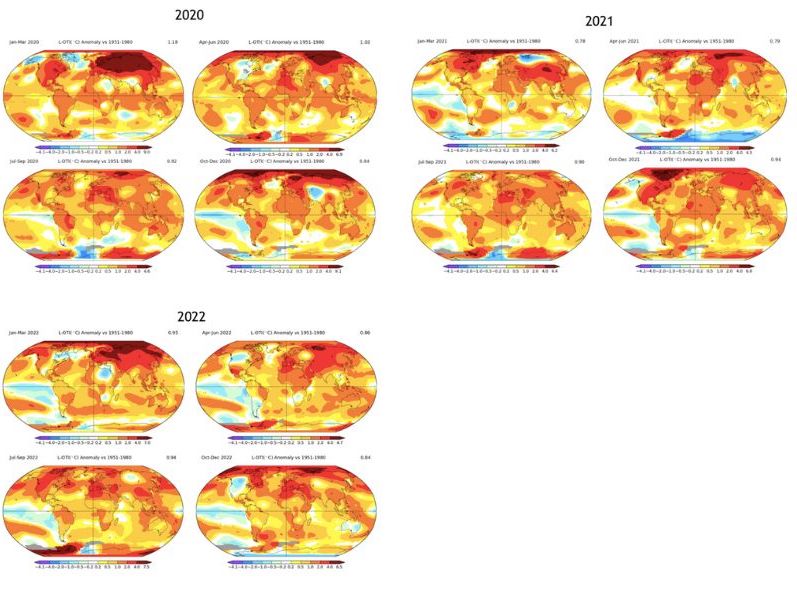
Seasonal temperature anomalies during the recent La Niña years (2020 – 2022,) shown in Figure 3, can provide some clues.

First, warm anomalies dominate, except in the eastern equatorial Pacific Ocean where cooler sea surface temperatures (pale blue) develop and fluctuate. The La Niña map in Figure 1 indicates that cooling anomalies sometimes appear over southern Africa, southern South America, India and eastern Australia, but that is not always the norm as the maps in Figure 3 suggest. Cooler anomalies may have occurred in these regions but rises in temperature due to global warming have weakened the seasonal cooling or altered the cooling cycle altogether.
Second, there is no evidence of the La Niña seasonal cooling tendency for northern South America and the northeast coast of Africa as indicated in Figure 1. Instead, each season in Figure 3 experienced warming anomalies that supported climatic conditions suited for extreme heat episodes.
Third, an El Niño shift towards warmer conditions (Figure 1) in much of the Southern Hemisphere would be of concern for South America and Africa given recent warm anomalies. Cool season warm tendencies in the Mediterranean, northeast North America and southern Asia suggest less challenging El Niño influences. Climatic warming mechanisms other than ENSO appear to dominate the incidences of extreme heat during the northern hemisphere warm season.
In summary, the ENSO phase guidance for warming or cooling influences can be difficult to assess in a warming world. However, any transition from a La Niña to an El Niño phase will likely produce a rise in global average surface temperature with warming tendencies affecting the development of extreme heat in the Southern Hemisphere.
A generally warmer global phase will follow the end of a La Niña phase and is a call to action for extreme heat planners. More extreme heat must be anticipated. The joint influence of both El Niño warming and rising global temperature amplifies the potential for extreme heat episodes in many regions. Pre-existing regional drought conditions will enhance heating cycles during heatwaves, compounding water scarcity, as well as fire, smoke and flash flood hazards. Drought relieving rains in some regions has provided relief from these compounding heat-related hazards.
For planners, it is even more important to consider seasonal guidance when supporting decision-makers as they prepare their communities to face episodes of extreme heat. Decision-makers may want to reach out to their National Meteorological Service or Regional Climate Centre to see what seasonal outlooks or guidance may be available, such as this Bulletin for the Caribbean. As demonstrated by comparing the climate guidance shown in Figure 1 with the records from the recent La Niñas in Figure 3, care must be taken to develop scenarios that build confidence in later advice. This is particularly important when more skillful short term weather forecasts and warnings provide certainty for when communities should implement their heat action plans.