Can Turin beat the heat? The socioeconomic factors at play in the urban heat island effect in an Italian city

To better understand the implementation of a micro-scale urban heat island risk assessment, researchers conducted a study using Turin as a subject – the first time that such an in-depth methodology is applied in any Italian city.
Extreme weather conditions – including heat waves, and the urban heat island (UHI) phenomenon– are among the predominant challenges for urban design and planning. Worsening climatic conditions amplify pre-existing fragilities in social contexts, and climate change is exacerbating these threats to city dwellers
In Italy, limited analyses have been conducted to determine who, how and where people are most vulnerable when extreme temperature conditions occur; even though Italian citizens are among Europe’s populations most affected by extreme heat.
To improve the knowledge base for the implementation of a micro-scale UHI risk assessment through the examination of the heat-health, we conducted a study using Turin as a subject. To the best of our knowledge, this is the first time that such an in-depth methodology is applied in any Italian city.
Copernicus Sentinel data, processed by ESA (CC-BY-SA IGO)
Mapping risk: hazard, exposure, vulnerability
Our proposed risk framework provides for a quantitative assessment for each district of the city, taking into account the interaction between three main factors: hazard, exposure and vulnerability.
Georeferenced maps were created for each indicator in order to improve local understanding of the spatial distribution of vulnerability factors. The proposed methodology and the results obtained constitute an initial phase of the study of urban risk in the context of the Turin case.
The phenomenon of urban heat islands (UHI), which refers to the effect whereby temperatures in cities are generally higher than in surrounding rural or suburban areas, represents a seasonal danger potentially compromising the health of urban populations . This analysis phase used the map developed for the city's Climate Resilience Plan.
The logic behind this existing elaboration was based on two approaches:
- The propagation of the maximum temperature recorded by on-site weather stations – in and around the city – during extreme temperature events, from 1753 to today.
- Heat loss from analyses (infrared thermal bands) by satellite imagery (e.g. Landsat and ASTER satellites) during recent heat waves.
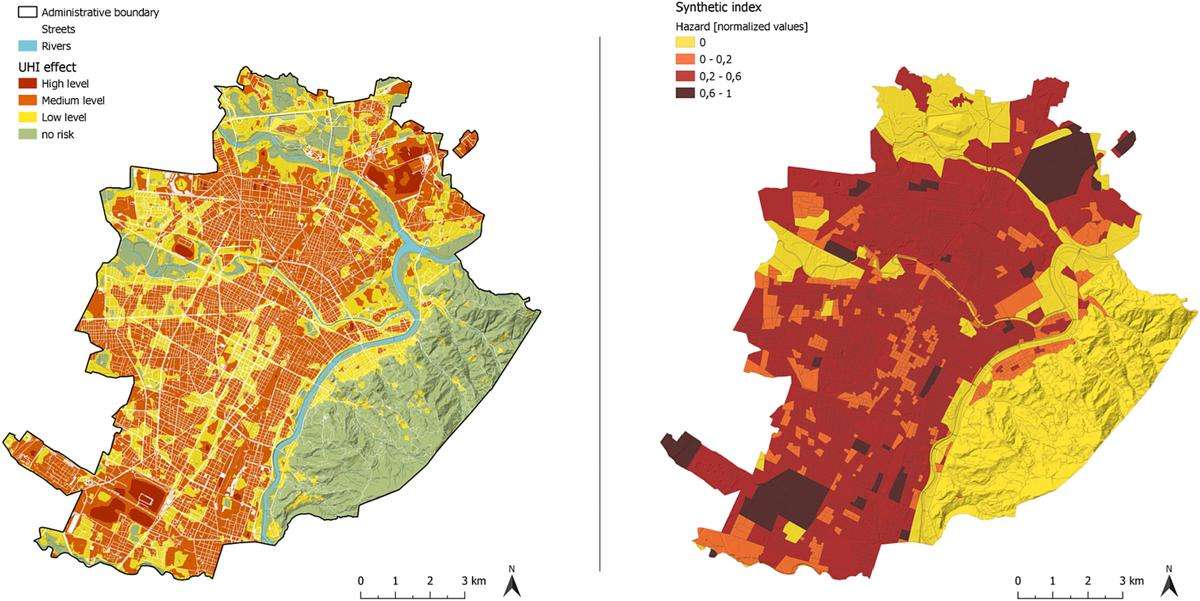
Figure 1: Maps showing UHI effect from the UHI raster (left) to the UHI hazard categorization (right)
The analysis examined three crucial elements:
- Climate risk (H), which translates into the assessment of the spread of the risk associated with the urban heat island within the city limits.
- Exposure (E), which refers to the presence of vulnerable groups within urban areas, subject to possible negative impacts deriving from urban heat island phenomena, such as the elderly population over the age of 65.
- Vulnerability (V), which has been divided into sensitivity (S) and adaptive capacity (AC).
This breakdown aims to clearly delineate:
- Personal and urban factors that may increase the vulnerability (consequently, the health risk) of exposed persons.
- The contexts and elements that contribute to reducing vulnerability, thus mitigating the health risks associated with Urban Heat Island events.
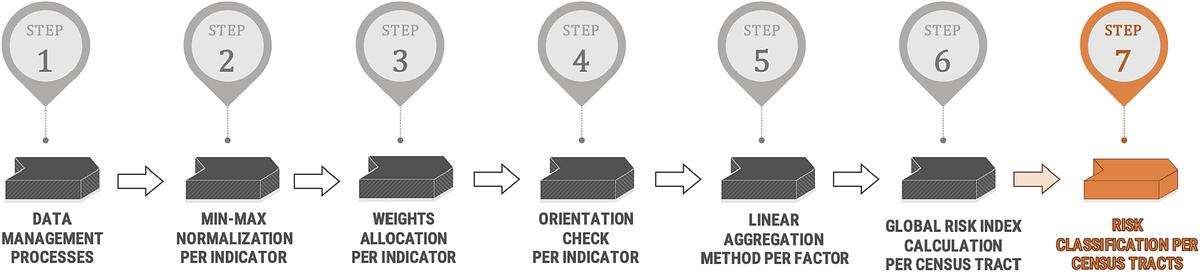
Figure 2: Micro-scale urban risk assessment framework: the step-by-step process.
Turin – densely urbanized areas are hottest
With a population of around 850,000, Turin is the largest city in northwestern Italy, and is the fourth most populous urban area of the country. Its geographical position is unique, surrounded by the Alpine chain on one side and the hills of Superga on the other.
In the 1950s and 1960s, the city experienced a significant social and economic transformation, which led to waves of migration from other parts of the country, and ultimately left a legacy of 10 million square meters of brownfield spaces.
These urban spots are characterized by mean temperatures of about 3 °C higher than the city's average during extreme events. Overall, the territory of Turin is densely urbanized, with construction covering nearly 65% of the city's total surface area.
To carry out the microscale UHI risk assessment, we produced a map for each factor included, to provide an understanding of the spatial differentiation of values by census trait, and thus giving specific information on the current diversification of UHI hazard:
- the exposure of the population
- associated vulnerabilities
- the final risk.
In this regard, Figure 3 below presents a complete mapping of these factors.
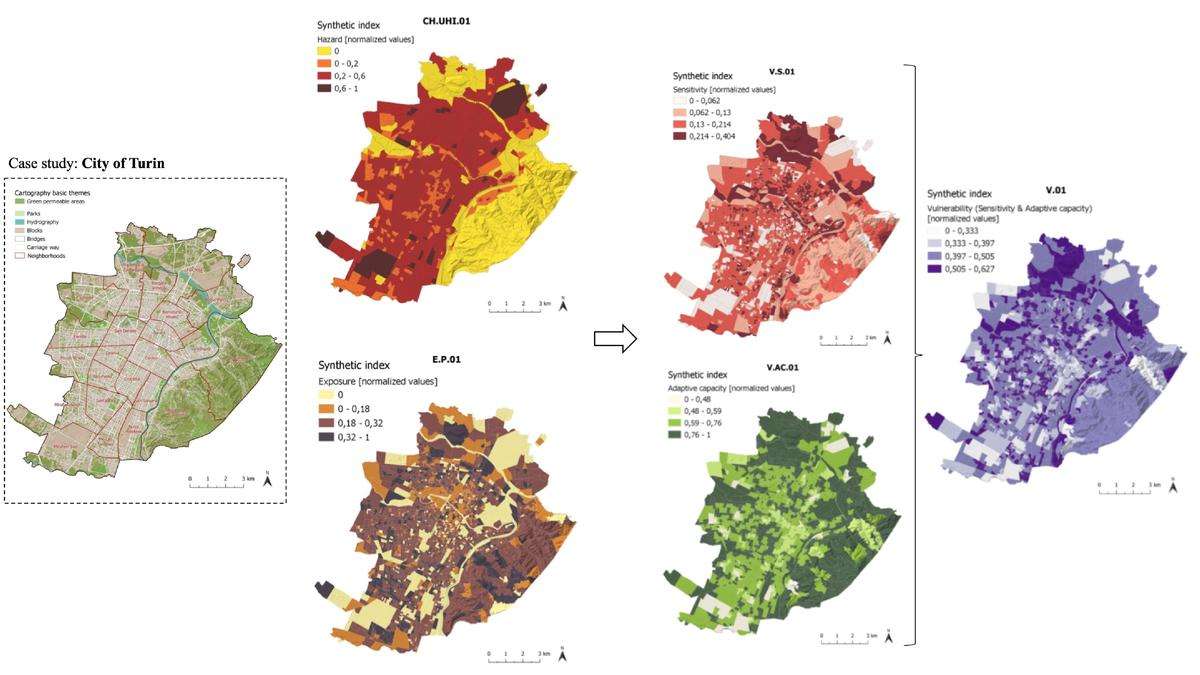
Figure 3: Mapping the factors underpinning the UHI risk assessment: Hazard (a), Exposure (b), and Vulnerability (c).
The outcome of the risk assessment revealed higher scores in areas with the largest extension of impermeable surfaces. These areas, particularly densely populated ones, also tend to score higher in terms of economic and social disadvantages.
More specifically, a greater intensity of the urban heat island effect was observed in several industrial and residential areas, mainly in the northwest and southeast part of the city, as well as in the historic centre, which is characterized by narrow streets and high-density buildings of six floors. When vulnerability was considered, the results were influenced by data on the social and economic factors of the population, as well as details of the structure of the external environment.
Areas of highest risk and highest priority
In summary, the areas at highest risk and the areas considered to be high priority for interventions are mainly located in the densely populated sections of the suburbs (eg: Barriera di Milano district to the north, Mirafiori, Parella, Pozzo Strada and Vanchiglietta).
The medium risk zones correspond mainly to the city centre.
Curiously, industrial areas, commonly identified as high UHI risk in recent literature, do not seem to achieve high or significant risk scores; this is mainly due to their low population density.
In general, the results suggest the need to develop UHI risk adaptation strategies for the population of Turin, particularly in areas identified as high risk. This involves an innovative approach, since such in-depth large-scale analyses have not yet been conducted in this city.
Editors' recommendations
- Micro-scale UHI risk assessment on the heat-health nexus within cities by looking at socio-economic factors and built environment characteristics: The Turin case study (Italy)
- Europe: Trees could prevent 30% of deaths caused by urban heat islands
- Cool solutions for a hotter climate: Tackling urban heat island effect with innovation
- Urban environment design reduces local heat islands
- More on the urban heat islands effect