Regional Assessment Report on Disaster Risk Reduction 2023 - Europe and Central Asia
Munich Re – the world’s largest reinsurer – has released its global disaster loss calculation for 2023, coming in at a total of US $250 billion. This roughly equals the entire GDP of New Zealand or Portugal. It is also slightly lower than the previous estimate for 2022, which originally came in at US $270 billion. But don’t start celebrating yet.
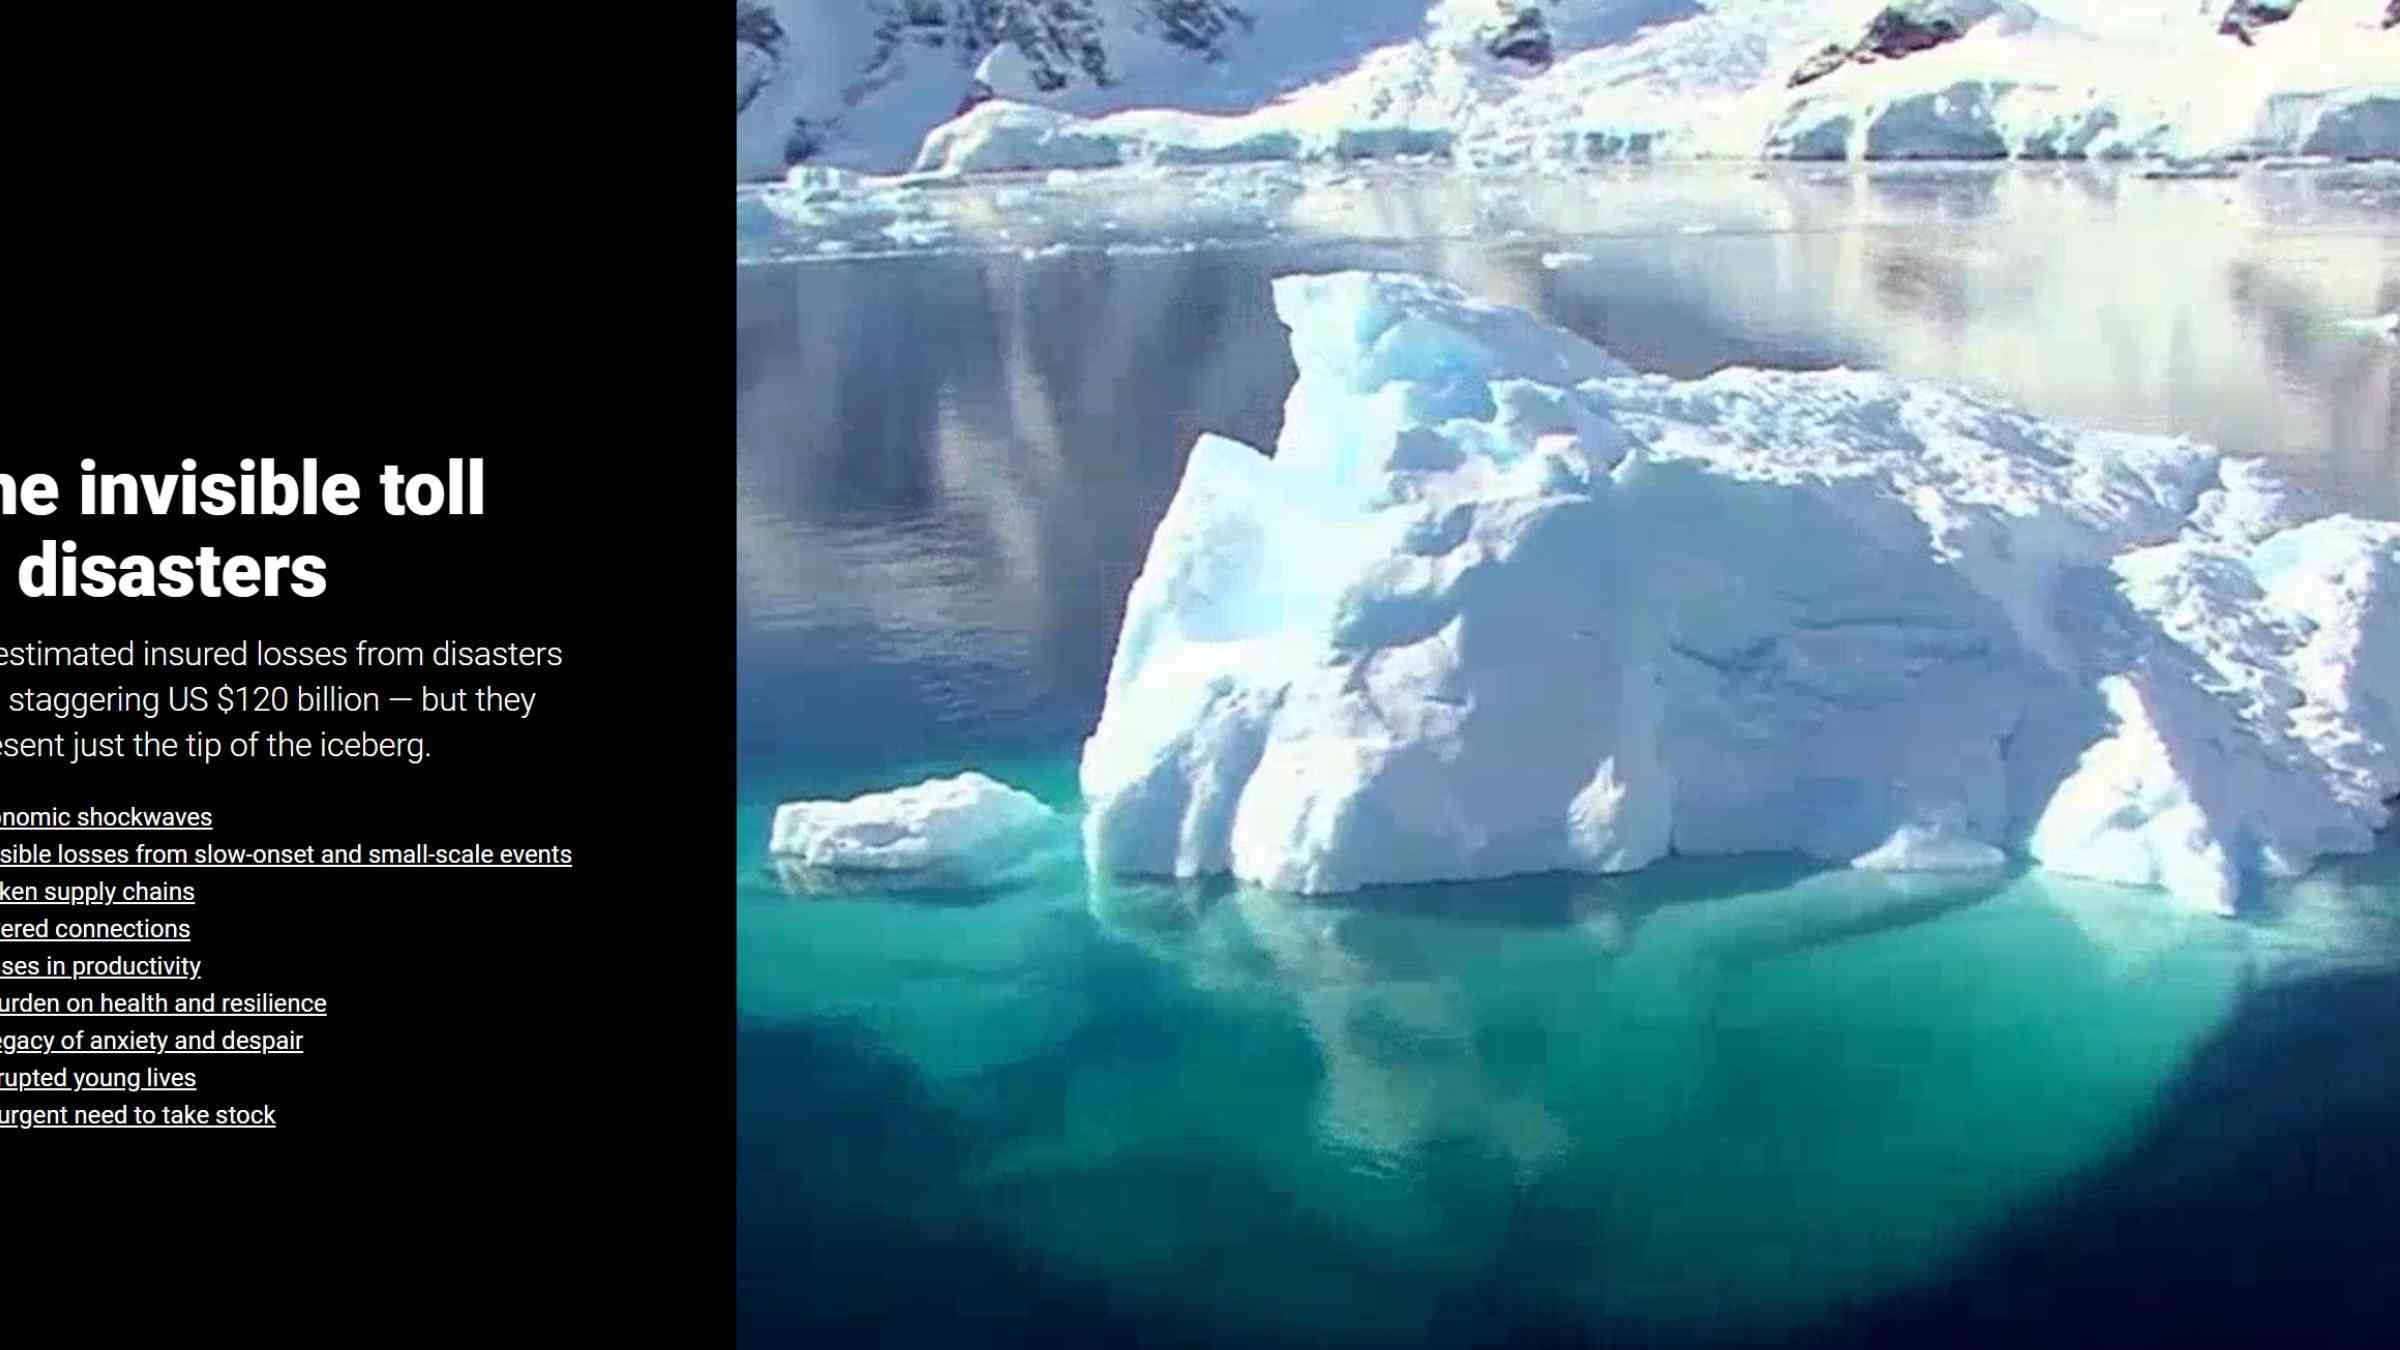
These estimates paint a partial picture of the true toll that disasters take, in terms of human lives and economic, developmental and social impacts.
Many of the impacts of disasters simply are not included in these estimates – such as those associated with slow-onset and small-scale events, and the knock-on effects of broken supply chains, losses in productivity, compromised physical and mental health, and the enduring impacts of disrupted education. All of these contribute to an invisible toll of disasters far greater than the insurers’ economic estimates.
Disasters resulted in 74,000 fatalities during the year, according to the report – well above Munich Re’s 5-year average of 10,000 disaster-related deaths (Statistics gathered via the Sendai Framework Monitor show an average disaster-related mortality for 2015-2022 as being almost 42,000 per year). 85% of these deaths, around 63,000 people, were caused by disasters involving major earthquakes – in Türkiye, Syria, Afghanistan and Morocco.
The event that had the greatest impacts, both in financial costs and lives lost, was the series of earthquakes striking in Türkiye and Syria in February, which Munich Re calculates as causing US $50 billion (of which $5.5 billion was insured) in damages, and taking around 58,000 lives.
However, most of the economic losses during 2023 result from major weather events – causing 76% of the disaster-related economic losses in Munich Re's stocktake.
The region that incurred the greatest economic losses was North America, accounting for 40% of global losses costing US $160 billion (US $ 100 billion of which was insured). Wealthier nations usually incur the highest financial losses from disasters because they have more high-value assets – which are more likely to be insured – but poorer countries bear a disproportionate economic burden relative to their overall wealth.
While losses are greater in high income countries in terms of absolute dollar values, the share of economic loss in low-income and lower middle-income countries is much higher than the global average, with direct economic loss averaging 0.37% of global GDP of countries reporting via the Sendai Framework Monitor (2015-2022). Poorer countries also suffer the greatest losses in terms of lives lost and disrupted.
Understanding the gaps in the data
The calculations tend to be biased in favour of insured losses: insurers have comprehensive data about their clients’ insured assets, and these form the backbone of loss estimates. When it comes to assessing the value of uninsured losses, the data are more patchy and hence the estimates less certain.
Likewise, those countries and regions in which there is greater insurance coverage have a greater proportion of more reliable data on insured assets, and so the overall estimate is more reliable.

There is also a skew towards big events that are widely reported, while we know that small events, while rarely reported, accumulate significant losses.
Data are not only collected by insurance companies. Municipalities, national governments, international organisations, and non-governmental organisations all gather information about disaster losses.
However these data are often not comparable, and may reflect inherent biases resulting from how they were collected and for what purposes. In some cases, for example, recording a higher number of victims could influence the amount of aid assigned; or conversely, a lower number of victims could absolve authorities from blame.
Taken together, the complexities in recording, reporting and compiling disaster impact records frequently result in data sets that are fragmented, disjointed or incomplete, particularly in databases with a global reach..
An analysis of the Centre for Research on the Epidemiology of Disasters’ (CRED) International Disaster Database (EM-DAT) – one of the most comprehensive public datasets on disaster losses and found major gaps especially concerning economic losses – found that the percentages of missing impact data for natural hazard disasters between 1990 and 2022 amounted to 96% for reconstruction costs, and 42% for total estimated damages.
Failing to account for missing data introduces significant bias into analyses and can lead to misinformed DRR policies and practices. Ultimately, putting people's lives at risk.
Storm clouds are gathering

The Munich Re report shows that storms in the Pacific were responsible for the second and third most expensive disasters.
Typhoon Doksuri made landfall at Jinjiang in Fujian province on the Chinese mainland in July, with damages costing US $25 billion (of which $2 billion was insured). Hurricane Otis, in October, struck the resort town of Acapulco, Mexico, resulting in losses estimated at US $12 billion (US $4 billion was covered by insurance).
In the US, thunderstorms in the Midwest (in March) and Texas (in June) were amongst the costliest disasters, with a combined loss of US $17 billion (US$ 12bn insured).
Thunderstorms in Europe also incurred major damage – including storms raining down grapefruit-sized hailstones in Northern Italy, with damages in the billions.
Storms elsewhere inflicted widespread losses, including tropical storm Jasper in Queensland, Australia and Cyclone Freddy in Mozambique.
Yet, the costing of damages for these storms becomes less precise as the proportions of uninsured to insured losses increases. Even in the US, the world’s most storm-prone country with a rich seam of data about losses, the cost estimates do not include expensive, long-term impacts like environmental degradation of vital natural resources, health-care costs, or cascading impacts through the supply chain or business disruptions.
These totals should be considered as conservative with respect to what was truly lost, given how many losses cannot be reliably measured due to a lack of consistently available data. As with all natural hazards, storm data present their own challenges when trying to identify patterns, trends and human impacts. Complications with global storm data include gaps in historical records, varied recording and reporting practices over time and around the world, and a wide range of variables that contribute to storm formation.
Opening the floodgates
Data on flooding shows the critical need for disaggregated data about the impacts and drivers of climate hazards, to better understand the mechanisms that cause extreme events and human disasters.
In May and August storms along Europe’s Adriatic coast produced torrential rainfall and widespread floods. In September a tropical cyclone-like storm, Medicane Daniel, struck the Mediterranean, causing floods in Greece and neighbouring countries. These floods together caused damages of US $17 billion in Europe (US $2 billion of which was insured), the Munich Re report calculates.

Medicane Daniel also made landfall in Libya, bursting dams to flood the city of Derna, taking a human toll of at least 4,000 of its inhabitants, with more than double that number remaining unaccounted for – many of whom may have been swept out to sea.
In Southern Africa, Cyclone Freddy – which lasted five weeks, and holds the record for the longest cyclone recorded – made landfall in Madagascar and struck Mozambique twice. More than 1,400 people died as a result of the storm and ensuing floods in Mozambique the nearby region.
In Australia’s northeast severe flooding occurred in mid-December as a result of tropical storm Jasper with 800 mm of rain in just one day – around the average annual rainfall in Germany, bursting the banks of a number of rivers.
As climate change intensifies, the risk of flooding increases both in traditional flood zones, and in new locations. Certain types of floods, such as flash floods and glacial lake outburst floods, are becoming more frequent. Better, disaggregated data is critical in order to build a better understanding, to better prepare and mitigate risks.
While historic data exist for some flood types in some areas, these records are often broad-brush, fragmented, and lacking the detail and quality needed to form reliable benchmarks against which to calculate current or future risks. This broad-brush approach fails to identify the unique features of myriad subtypes, and therefore the individualised mitigation and adaptation responses they demand.
Turning up the heat

In January 2024 the Copernicus Climate Change Service confirmed that 2023 is the hottest year on record, and that July and August of that year were the hottest months on record.
While Munich Re reports on this alarming phenomenon, heatwaves don’t figure in the accounting of the economic toll of disasters in 2023, possibly because the costs of extreme heat, while extensive, are largely indirect – such as lost productivity and costs to human health.
The International Labour Organisation has estimated losses in productivity from heat stress US$2,400 billion by 2030 – assuming a 1.5°C global temperature rise scenario – the equivalent of 80 million full-time jobs.
The most at-risk from extreme heat are the least represented in the global data. We do not know – and cannot pin down without better methodologies – either subnational or global totals for deaths attributable to heatwaves. Heatwaves in Europe and North America are far more readily recorded in global datasets, such as EM-DAT, than their equivalents in tin the global south. Africa's extreme heat remain vastly underrepresented. This data deficit is alarming, considering the 336% surge in the number of Africans affected by extreme heat compared to the 1981-2010 period.
This underreporting has severe consequences. It hinders efforts to effectively address the plight of the majority of the world's urban population, who reside in the Global South. Moreover, low-income communities bear the brunt of heat-related hazards, often living in densely packed housing, with little or no access to cooling technologies and the power they require, or heat-resistant building materials.
Throughout the world, demographic subgroups such as undocumented workers, socially vulnerable individuals and other marginalized people are also often excluded from national tallies of heatwave health impacts, including deaths.
Addressing this data disparity is crucial for developing effective heat mitigation strategies.
The world is on fire
In Hawaii, wildfire in August affected the coastal town of Lahaina, on Maui, with losses of around US $5.5 billion (US $3.5 billion insured), Munich Re reports.
Wildfires in Canada, while laying waste to thousands of hectares of forest, did not reach major populated or industrial centres and the costs were therefore much lower than previous events such as the Fort McMurray fires of 2016.
Data shows a steady increase in wildfires globally, and a dramatic increase in the number of people suffering health impacts from wildfire.

The effects of wildfire are also long term – beyond the immediate damage to property (whether insured or uninsured) the loss of productive land, and the health impacts on those affected, can have enduring ramifications lasting years or decades.
While mortality is lower than, for example, storms or floods, being caught in a wildfire has serious health implications. Burns require specialist medical help, which may be hard to access if roads and communications are cut due to flames, smoke and physical damage. Inhalation of the high levels of particulate matter and toxins in woodsmoke causes respiratory, cardiac and ophthalmic diseases, while psychological trauma and mental ill-health can also seriously affect survivors. Post-fire pollution in the air, land and water can exacerbate initial health impacts, especially when toxic waste or industrial products are ignited by the wildfires.
The countries most affected by wildfire are largely in the global South. While Australia has the most total average land area burned by wildfires (45 million hectares), the top 10 list of countries by percentage of land burned are all in Africa – led by Zambia (30%) and Angola (29%). These damages undoubtably have a huge impact on the lives and livelihood of those affected, but are unlikely to be accounted for in the financial loss estimates.
The destruction of biodiversity and ecosystems, and damage to natural services such as healthy soils and water systems, are particularly hard to quantify monetarily, but have a material impact on the ability of both human and natural communities to recover. The figures that are available, notably data on insured losses, once again skew the global pattern of economic costs towards wealthier nations, and wealthier regions within countries, thanks to their higher asset values and higher levels of insurance..
What can be done?

Inadequate disaster data hinder our understanding of climate hazards, and undermines disaster risk reduction efforts. This data deficit is particularly concerning as the climate crisis makes extreme events the new normal.
Data gaps point to the need for greater investments in enhancing the collection, analyses and application of disaster impact data, further propelled by recent decisions on loss and damage at the last two climate change conferences (COP27 and COP28).
Increasingly we need to make sustainable development a core component of disaster recovery – but this depends on improved data governance, and collection, analysis, and utilization.
To make this a reality, we must strengthen data governance, and we must increase the capacities for contemporary data management and its use:
- Standardize data collection, processing, and analysis for better quality data.
- Disaggregate data to capture smaller-scale events and identify vulnerable populations.
- Improve country capacity in recording and assessing economic losses from local to national level.
- Create global statistics standards for direct and indirect economic losses.
- Strengthen collaboration across key disaster data stakeholders (such as hydro-met services, geographic departments, disaster risk management, public health, and statistics offices) to enhance data interoperability, and enable use and reuse.
- Enable partnerships involving civil society, the private sector and governments for more comprehensive and inclusive data.
- Improve data communication and operationalization for effective policy making.
- Translate data insights into actionable strategies for resilience building.
To this end, UNDRR is working with UNDP and WMO partners to enhance national and local capacities to systematically capture data on hazardous events and disaster losses and damages.
Note
The analysis in this article is based on the report Closing Climate and Disaster Data Gaps: New challenges, new thinking (UNDRR, 2023)