

 |
Global Assessment Report on Disaster Risk Reduction 2011
Revealing Risk, Redefining Development |
  |
5.2. Revealing risk and identifying development trade-offsIf governments were to account for recurrent disaster losses and for their future liabilities, they may begin to make more considered decisions based on an assessment of the costs, benefits and trade-offs internalized in risk-sensitive public investment.
In nationally reported disasters in the 21 countries in Africa, Asia and Latin America analysed in Chapter 2, there were 63,667 schools and 4,873 health facilities damaged or destroyed since 1989. During this period, 73,000 kilometres of roads were also damaged, and 3,605 municipal water systems, 4,400 sewer systems and 6,980 power installations were reported damaged and destroyed. Of these total losses, 46 percent of the schools, 54 percent of the health facilities, 80 percent of the roads and more than 90 percent of the water, sewer and power installations were damaged or destroyed in frequently occurring extensive disasters rather than in occasional and intensive catastrophes.5 These losses are massive, and they indicate how public investments in social and economic development are in practice often investments in risk construction and contingent liability (Cardona, 2009 Cardona, O.D. 2009. La gestión financiera del riesgo de desastres: Instrumentos financieros de retención y transferencia para la comunidad andina. Lima, Peru: PREDECAN, Comunidad Andina. ). This large loss of publicly owned assets remains largely invisible and unaccounted for (Gall et al., 2009. Gall, M., Borden, K. and Cutter, S. 2009. When do losses count? Six fallacies of natural hazards loss data. American Meteorological Society 90 (6): 799–809. ), and impacts are transferred to affected low-income households and communities. This invisibility represents a major political barrier to investing in DRM. Revealing these impacts will not automatically lead to greater investment, but if governments were to account for these recurrent losses and for their future liabilities, they may begin to make more considered decisions based on assessments of the costs, benefits and trade-offs internalized in public investment.. As explained in Chapter 1, a country’s stock of risk comprises a combination of high-severity, low-frequency intensive risks, and low-severity, high-frequency extensive risks. Normally, neither conventional catastrophe risk models nor risk models based on historical disaster-loss data are able to comprehensively estimate both of these risk strata. Fortunately, national disaster loss reporting (see Box 2.5 in Chapter 2) and the growing availability of open-source probabilistic models, such as CAPRA,6 have facilitated the development of innovative hybrid models that can estimate both extensive and intensive risks. One such hybrid model (Box 5.3), which combines historical disaster loss data and probabilistic catastrophe risk modelling, has been piloted in Colombia, Mexico and Nepal (  ERN-AL, 2011 ERN-AL, 2011 ERN-AL, 2011. Probabilistic modelling of disaster risk at global level: Development of a methodology and implementation of case studies. Phase 1A: Colombia, Mexico, Nepal. Background Paper prepared for the 2011 Global Assessment Report on Disaster
Risk Reduction. Prepared by the Consortium Evaluación de Riesgos Naturales – América Latina. Geneva, Switzerland: UNISDR. ERN-AL, 2011. Probabilistic modelling of disaster risk at global level: Development of a methodology and implementation of case studies. Phase 1A: Colombia, Mexico, Nepal. Background Paper prepared for the 2011 Global Assessment Report on Disaster
Risk Reduction. Prepared by the Consortium Evaluación de Riesgos Naturales – América Latina. Geneva, Switzerland: UNISDR.Click here to view this GAR paper. Box 5.3 The hybrid risk model
Loss exceedance curves are normally used to express the probable maximum losses (PML) that can
occur in a given period, or the probability of exceeding a given level of loss in a given period. For
example, an exceedance rate of 0.1 means there is a 10 percent probability of a given loss occurring in
a year, formally representing a return period of 10 years for that loss. An exceedence rate of 10 means
that it is probable that the loss is exceeded 10 times in a year. The curves can also be used to estimate
annual average loss, being the expected annual loss over the long term. The hybrid risk model is built by constructing two loss exceedance curves: one derived empirically from recorded disaster losses for all the hazards to which the country is exposed, and the other derived analytically for major hazards, such as earthquakes and tropical cyclones. The empirical loss exceedance curve is constructed by assigning monetary values to recorded disaster losses for all weather-related and geological hazards in national disaster databases, applying parameters widely used in disaster impact assessments.7 The resulting curve models probable maximum losses up to a return period of approximately 40–50 years, accounting for most extensive risk. The analytical loss exceedance curve is constructed by measuring the quantity and value of a proxy of the exposed assets to hazards of different intensities in each sector (e.g., housing, energy, health, transportation). These are assigned to vulnerability functions in order to estimate probable losses, e.g. different earthquake vulnerability curves are used for buildings with different construction systems. The analytical loss curve represents the fiscal or sovereign risk associated with major hazards, such as earthquakes in Colombia and Nepal, and both earthquakes and tropical cyclones in Mexico. When the two curves are integrated as presented in Figure 5.2 for the case of Colombia, the empirical curve estimates higher probable maximum losses than the analytical curve for the strata of extensive risks, with direct losses of up to US$30 million occurring once a year. This confirms that the analytical loss curve does not accurately capture extensive risks. However, the analytical curve estimates higher probable maximum losses for longer return periods, confirming that the empirical loss curve underestimates intensive risks, particularly those with very long return periods. By combining both, the hybrid loss exceedance curve enables governments to estimate the full spectrum of disaster risks they face. Figure 5.2
The hybrid loss exceedance curve for Colombia 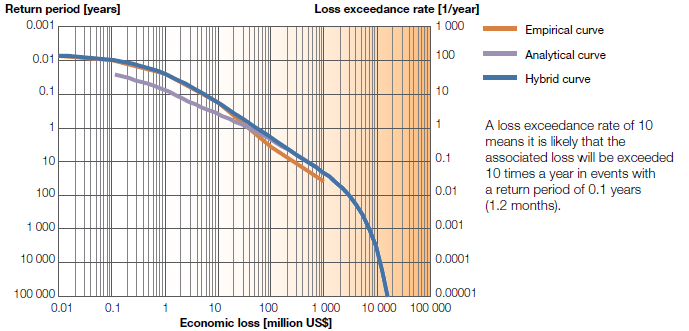 (Source: ERN-AL, 2011 ERN-AL, 2011. Probabilistic modelling of disaster risk at global level: Development of a methodology and implementation of case studies. Phase 1A: Colombia, Mexico, Nepal. Background Paper prepared for the 2011 Global Assessment Report on Disaster
Risk Reduction. Prepared by the Consortium Evaluación de Riesgos Naturales – América Latina. Geneva, Switzerland: UNISDR.Click here to view this GAR paper. Estimates of disaster impacts are normally made only after large events,8 meaning that recurrent disaster loss is often unaccounted for. The evidence produced by applying the hybrid model in Colombia, Mexico and Nepal indicates that the scale of recurrent losses may be far higher than most governments realize (Figure 5.3). Estimated average annual disaster losses reach US$2.24 billion in Mexico, US$490 million in Colombia and US$253 million in Nepal. Figure 5.3
Hybrid loss exceedence curves for Colombia, Mexico and Nepal 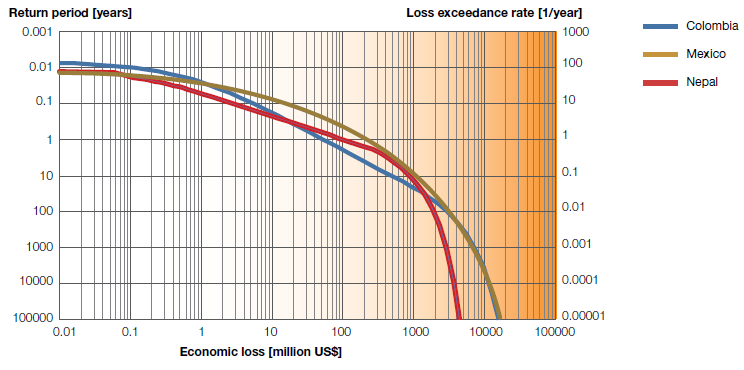
(Source: adapted from
ERN-AL, 2011 ERN-AL, 2011. Probabilistic modelling of disaster risk at global level: Development of a methodology and implementation of case studies. Phase 1A: Colombia, Mexico, Nepal. Background Paper prepared for the 2011 Global Assessment Report on Disaster
Risk Reduction. Prepared by the Consortium Evaluación de Riesgos Naturales – América Latina. Geneva, Switzerland: UNISDR.Click here to view this GAR paper. Analysis based on the hybrid loss exceedance calculation for Colombia shows that the government may have to address losses in publicly owned assets as well as the uninsured private assets of low-income groups, ranging from US$100,000 (100 times per year) to US$1 billion (at least once every 30 years). In Mexico, and excluding impacts from drought and in the agriculture sector, the government is likely to incur weather-related disaster losses of over US$1 million at least 50 times a year, of more than US$15 million at least 10 times a year, more than US$300 million at least once a year, and more than US$1 billion at least once every 6 years. In Nepal, the government is implicitly liable for losses amounting to US$1 million almost 10 times each year, and of US$100 million almost every second year. This is the real scale of disaster loss in these countries. It gives an idea of the magnitude of the public funds required if a government were to compensate for and replace public assets, and support the recovery of low-income households and communities. Also, it is not just recurrent losses that governments are ill prepared to deal with. With some notable exceptions, governments are rarely adequately prepared, by either contingent financing or insurance, to cover the probable maximum losses from a low-probability intensive event. Taken by surprise by liabilities that they have never assessed, governments are then forced to rely on slow and often unreliable international assistance for recovery and reconstruction. To put these losses into a political perspective, Figure 5.4 shows the value of nationally recorded losses for five successive presidential periods in Mexico from 1982 to 2009. All Mexican governments since 1982 have had to absorb disaster losses of over US$10 billion during their period in power, rising to almost US$20 billion in the new millennium. This is the scale of loss any incoming government is likely to have to deal with unless serious investments are made in DRM. Figure 5.4
Economic losses by presidential period, Mexico 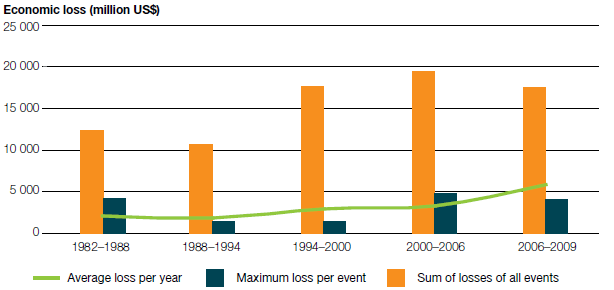
(Source: ERN-AL, 2011 ERN-AL, 2011. Probabilistic modelling of disaster risk at global level: Development of a methodology and implementation of case studies. Phase 1A: Colombia, Mexico, Nepal. Background Paper prepared for the 2011 Global Assessment Report on Disaster
Risk Reduction. Prepared by the Consortium Evaluación de Riesgos Naturales – América Latina. Geneva, Switzerland: UNISDR.Click here to view this GAR paper. From an economic perspective, the losses are significant in all three countries studied. In Colombia, for example, as Figure 5.5 shows, the estimated annual loss from disasters represents approximately 1 percent of GDP. Although this is less than the cost of cyclical unemployment, disaster losses are higher than the cost of 5 percent inflation, and are comparable to the cost of armed conflict, which was estimated at 1.1 percent of GDP for the period of 1991 to 1996. Furthermore, the maximum probable disaster loss with return periods of 500 and 1,000 years, represent costs of 2.3 percent and 2.9 percent of GDP, respectively, equivalent to the losses caused by the financial crises of the 1980s and 1990s ( Moreno and Cardona, 2011 Moreno, A. and Cardona, O.D. 2011. Efectos de los desastres naturales sobre el crecimiento, el desempleo, la inflación y la distribución del ingreso: Una evaluación de los casos de Colombia y México. Background Paper prepared for the 2011 Global Assessment Report on Disaster Risk Reduction. Geneva, Switzerland: UNISDR.Click here to view this GAR paper. Figure 5.5
Costs of disasters and macroeconomic events as a percentage of annual GDP in Colombia 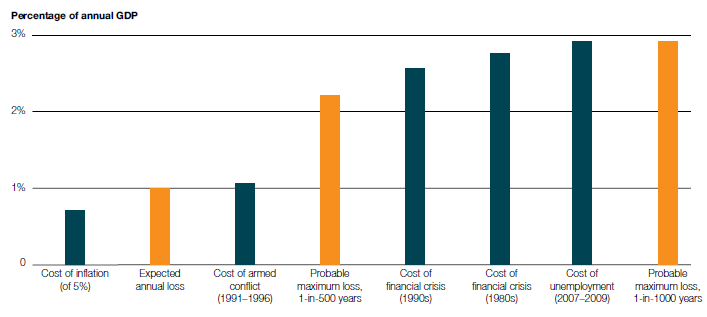
(Source:
Moreno and Cardona, 2011 Moreno, A. and Cardona, O.D. 2011. Efectos de los desastres naturales sobre el crecimiento, el desempleo, la inflación y la distribución del ingreso: Una evaluación de los casos de Colombia y México. Background Paper prepared for the 2011 Global Assessment Report on Disaster Risk Reduction. Geneva, Switzerland: UNISDR.Click here to view this GAR paper. These figures indicate that if decision-making were based on a realistic assessment of the social and economic costs and benefits, DRM should have a similar public policy importance as controlling inflation or resolving armed conflict. In other words, a larger share of the national budget should be allocated to reducing disaster risks. Making these costs visible is also a key step towards identifying the trade-offs in DRM investment. These figures on disaster loss do not include the cost of indirect disaster impacts documented in the 2009 Global Assessment Report (de la Fuente and Dercon, 2008 de la Fuente, A. and Dercon, S. 2008. Disasters, growth and poverty in Africa: Revisiting the microeconomic evidence. Background paper prepared for the 2009 Global Assessment Report on Disaster Risk Reduction. Geneva, Switzerland: UNISDR. ; UNISDR, 2009.  UNISDR (United Nations International Strategy for Disaster Reduction). 2009. Global assessment report on disaster risk reduction: Risk and poverty in a changing climate. Geneva, Switzerland: United Nations International Strategy for Disaster Reduction. UNISDR (United Nations International Strategy for Disaster Reduction). 2009. Global assessment report on disaster risk reduction: Risk and poverty in a changing climate. Geneva, Switzerland: United Nations International Strategy for Disaster Reduction.Click here to go to GAR09 page. IDEA (Instituto de Estudios Ambientales). 2005. Indicadores de riesgo de desastre y de gestión de riesgos: Informe técnico principal / indicators of disaster risk and risk management. Main technical report. Manizales, Colombia: Universidad Nacional de Colombia.. ; Cavallo et al., 2010Cavallo, E., Galiani, S., Noy, I. and Pantano, J. 2010. Catastrophic natural disasters and economic growth. Department of Research and Chief Economist, IDB-WP-183. Washington DC: Inter American Development Bank. ;
. Moreno and Cardona, 2011 Moreno, A. and Cardona, O.D. 2011. Efectos de los desastres naturales sobre el crecimiento, el desempleo, la inflación y la distribución del ingreso: Una evaluación de los casos de Colombia y México. Background Paper prepared for the 2011 Global Assessment Report on Disaster Risk Reduction. Geneva, Switzerland: UNISDR.Click here to view this GAR paper. Notes Indonesia, Maldives, Sri Lanka and Thailand. 5 All figures are taken from UNISDR’s Global
Assessment Report Data Universe, available at www.
preventionweb.net/gar. 6 Comprehensive Approach for Probabilistic Risk
Assessment. For more information on CAPRA please
see www.ecapra.org. 7 The parameters used are derived from methodology
developed by the Economic Commission for Latin
America and the Caribbean (ECLAC) for evaluating
disaster impacts (ECLAC, 2002 ECLAC (Economic Commission for Latin America and the Caribbean). 2002. Handbook for estimating the socio-economic and environmental effects of disasters. Report LC/MEX/L.519. Mexico DF, Mexico: Economic Commission for Latin America and the Caribbean. ). This methodology is
widely used following major disasters throughout the
world by the World Bank, regional development banks
and the United Nations. This, however, does not take
account of indirect impacts and costs, for example, in
terms of increasing poverty or deteriorating education
and health.. 8 For example in the post disaster loss and impact
assessments produced after the Haiti earthquake in
January 2010, the Chile earthquake in February 2010,
and the El Salvador tropical storm in November 2009,
using methodology developed by ECLAC (2002). |

| |


 GAR 2011 Contributing Papers