

 |
Global Assessment Report on Disaster Risk Reduction 2011
Revealing Risk, Redefining Development |
  |
2.2 Global disaster risk trends
As the case of Dhaka illustrates, earthquake mortality risk may be increasing, particularly in countries experiencing rapid urban growth. In contrast, mortality risk associated with major weather-related hazards is now declining globally, including in Asia, where most of the risk is concentrated. Although the number of people exposed to tropical cyclones and floods continues to increase, countries are successfully reducing their vulnerabilities and strengthening their disaster management capacities. In East Asia and the Pacific, mortality risks for both floods and cyclones are now about one third of what they were in 1980, relative to the size of the region’s population: a major achievement. South Asian countries have struggled to reduce mortality risks, but these have also fallen over the last decade.
2.2.1 Weather-related mortality risk remains highly concentrated in countries with low GDP and weak governanceFigures 2.2 to 2.7 show an updated global distribution of mortality risk for three weather-related hazards (tropical cyclones, floods and rain-triggered landslides). In these maps, the areas of highest risk correspond to areas where high concentrations of vulnerable people are exposed to severe and frequent hazards. The risk model highlights that flood mortality risk is highest in rural areas with a dense and rapidly growing population in countries with weak governance; cyclone mortality risk is highest in isolated rural areas with low GDP per capita;6 and landslide risk is highest in areas with low GDP per capita. For all weather-related hazards, countries with low GDP and weak governance tend to have drastically higher mortality risks than wealthier countries with stronger governance.Figure 2.2
Mortality risk distribution from weather-related hazards (tropical cyclones, floods and rain-triggered landslides) in North America and the Caribbean as modelled  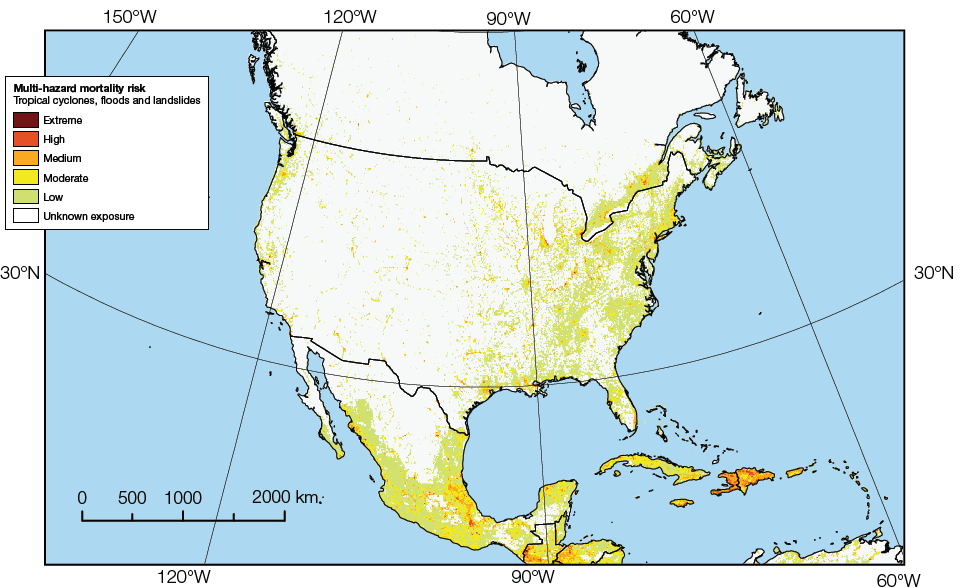
Figure 2.3
Mortality risk distribution from weather-related hazards (tropical cyclones, floods and rain-triggered landslides) in South America and the Caribbean as modelled  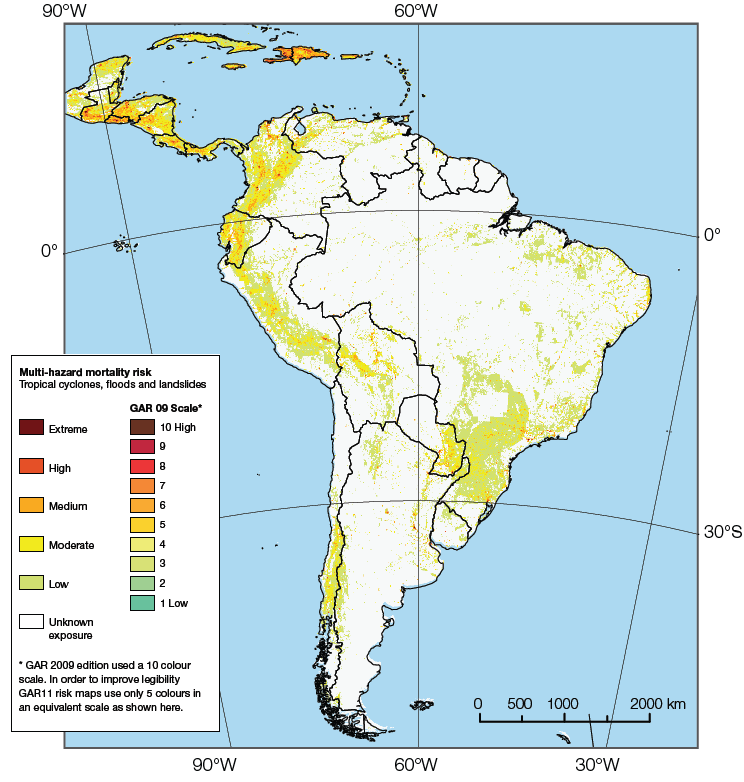
Figure 2.4
Mortality risk distribution from weather-related hazards (tropical cyclones, floods and rain-triggered landslides) in Europe as modelled  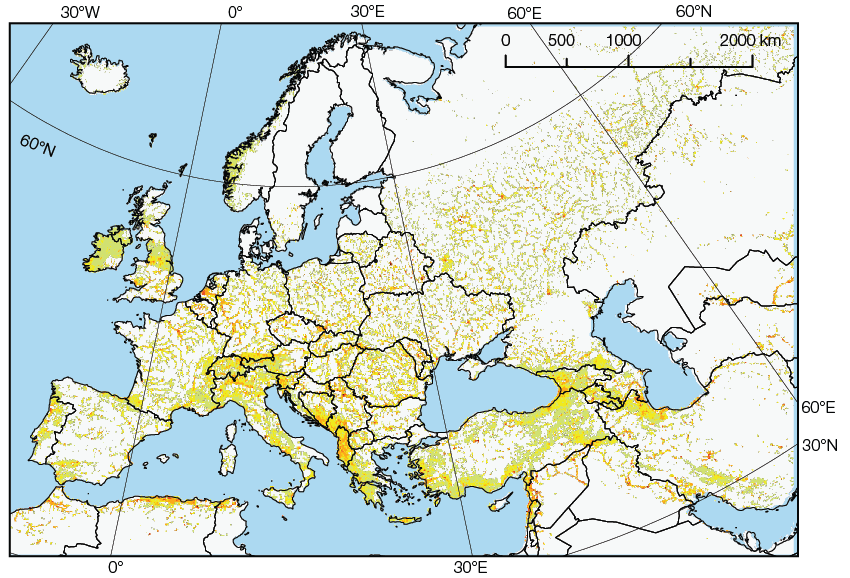
Figure 2.5
Mortality risk distribution from weather-related hazards (tropical cyclones, floods and rain-triggered landslides) in Africa as modelled  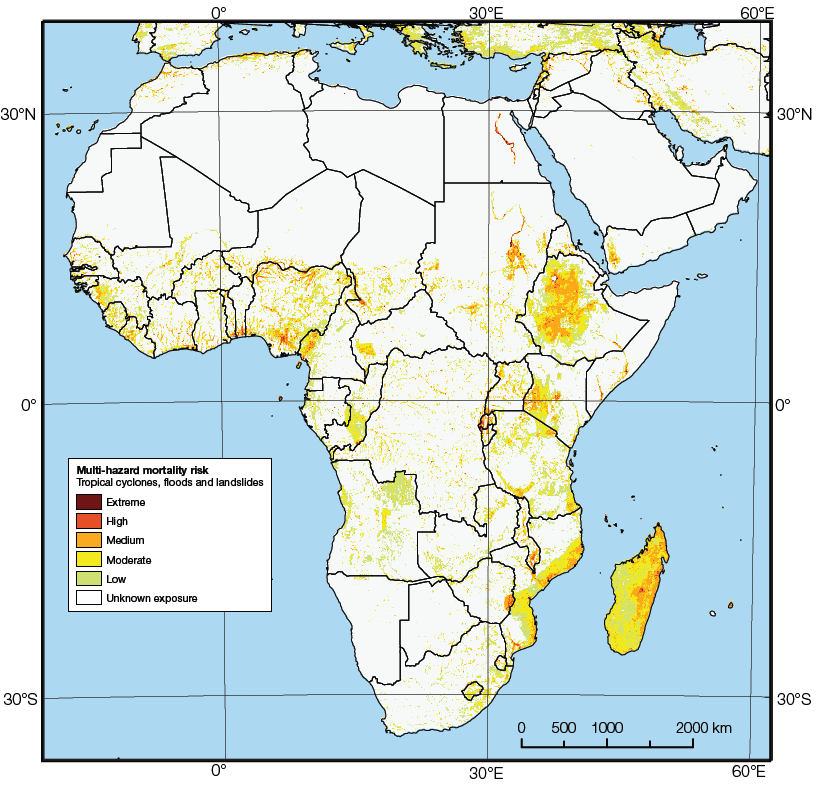
Figure 2.6
Mortality risk distribution from weather-related hazards (tropical cyclones, floods and rain-triggered landslides) in Asia as modelled 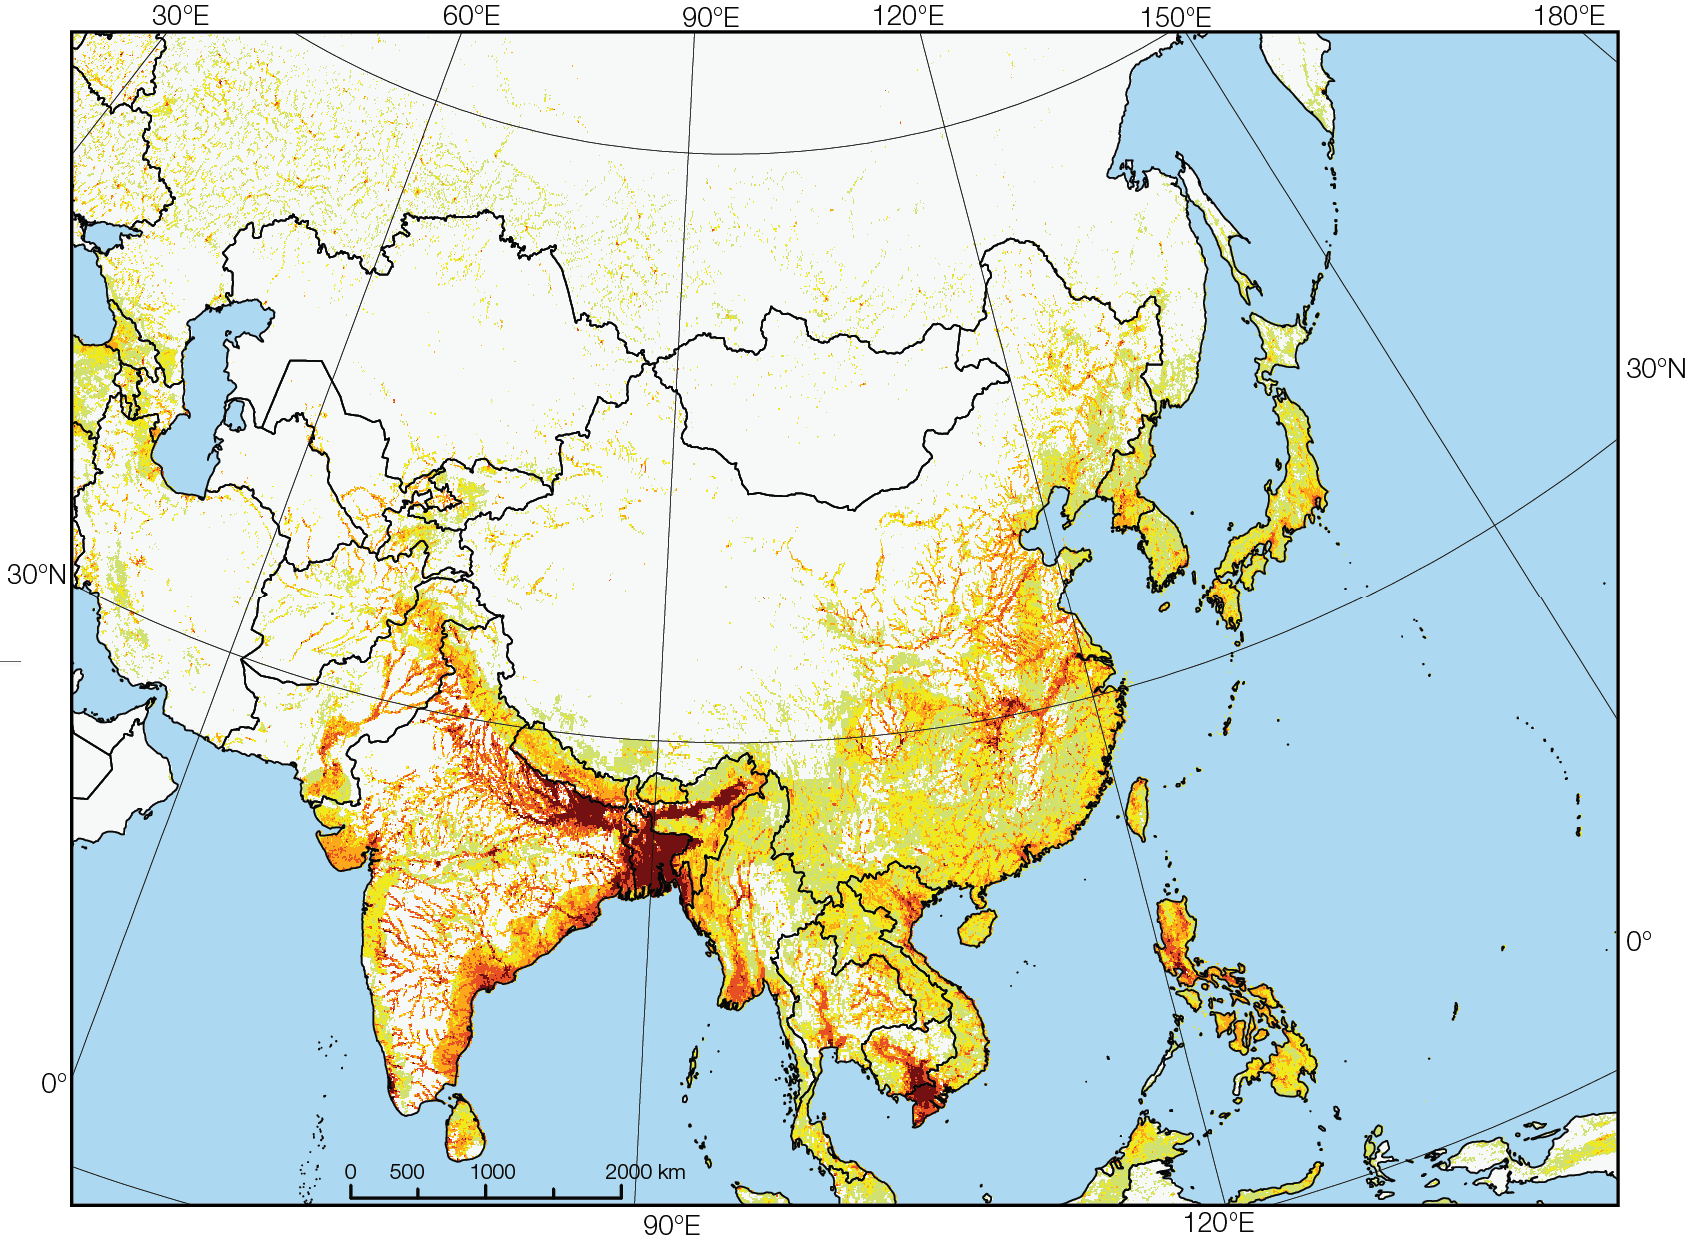 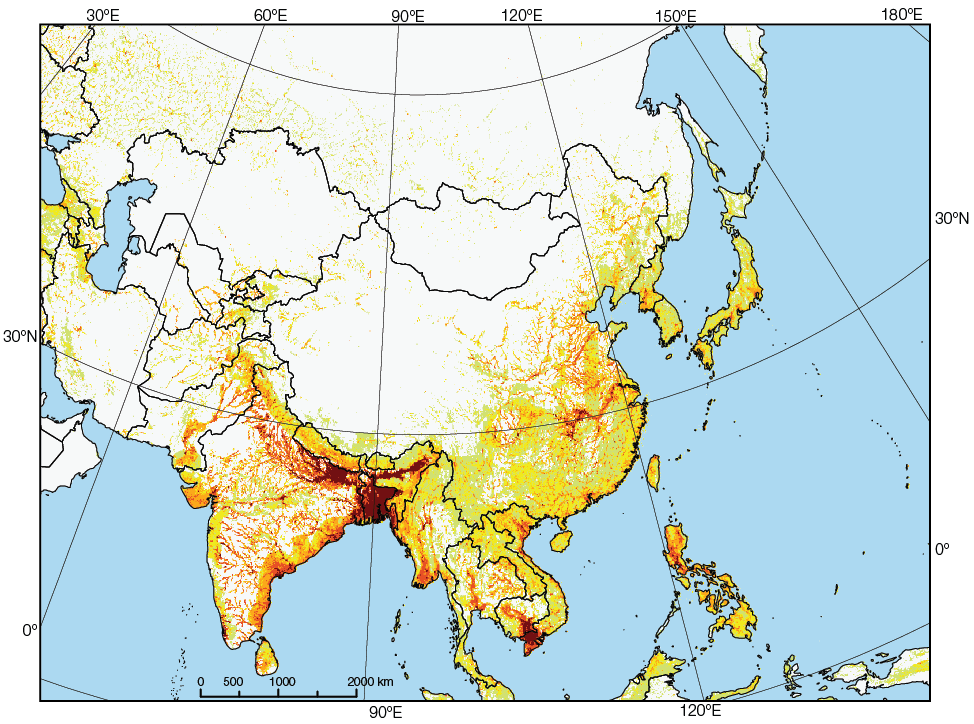
Figure 2.7
Mortality risk distribution from weather-related hazards (tropical cyclones, floods and rain-triggered landslides) in North America and the Caribbean as modelled 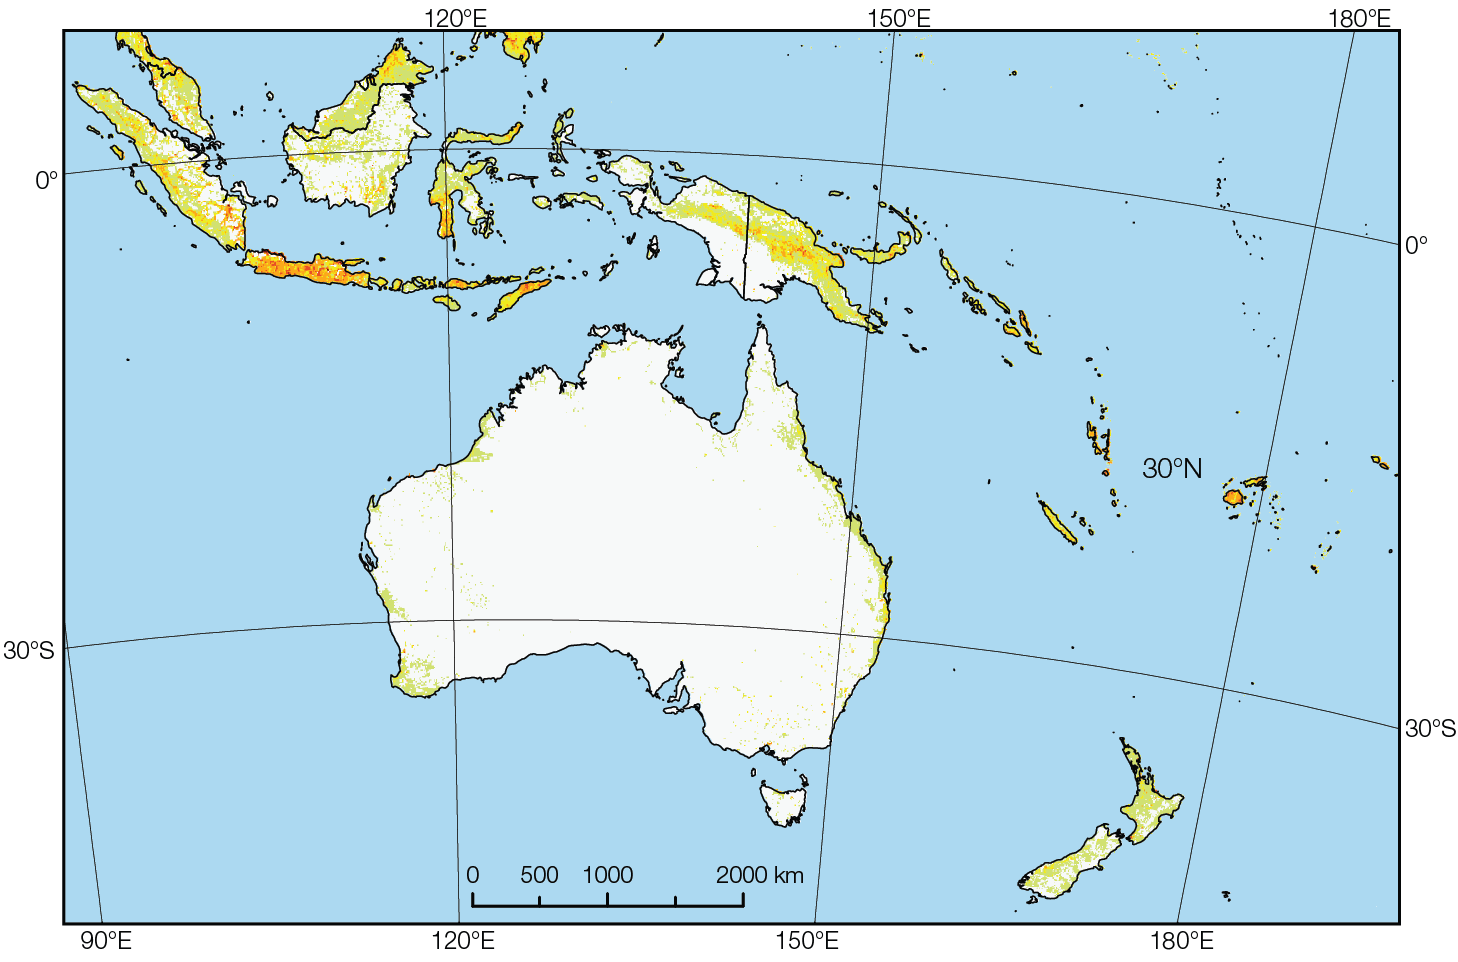 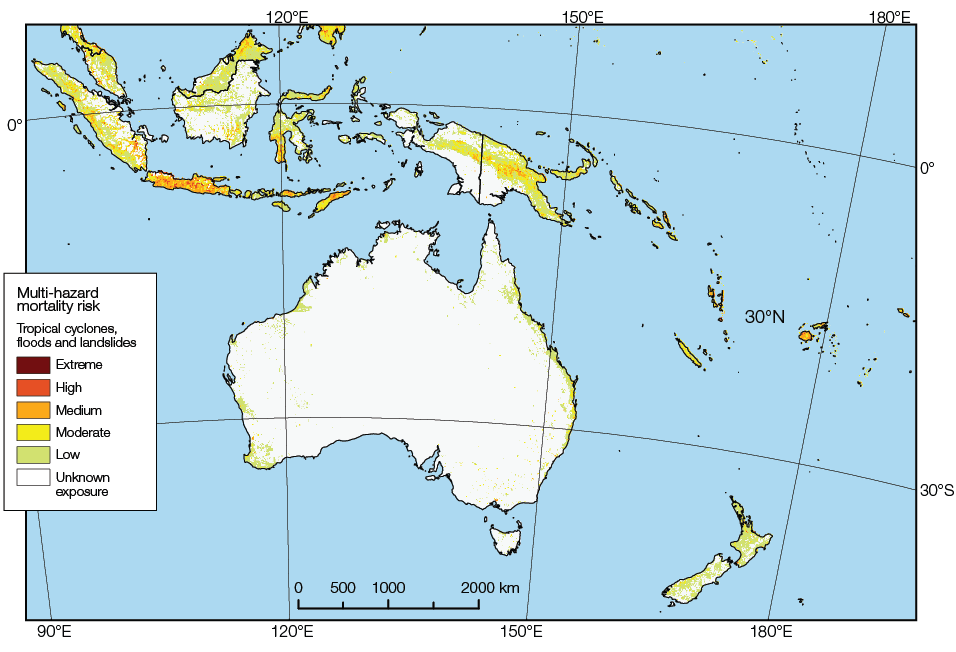
2.2.2 Exposure to floods and tropical cyclones is increasing rapidly, growing fastest in low-income countriesBetween 1970 and 2010, the world’s population increased by 87 percent (from 3.7 billion to 6.9 billion). In the same period, the average numbers exposed to flooding every year increased by 114 percent (from 32.5 to 69.4 million annually).7 Relatively speaking, ever more people are living in flood plains, suggesting that the economic advantages of living in such an environment must outweigh the perceived risks of flooding. Populations in cyclone-prone areas are also growing, highlighting the attractiveness of tropical coastlines for tourism as well as for economic and urban development in general.8 Global physical exposure to tropical cyclones almost tripled (increasing by 192 percent) between 1970 and 2010.Low- and lower-middle-income countries not only have the largest proportion of their population exposed to floods, but their exposure is also growing faster than in middle-income and Organisation for Economic Co-operation and Development (OECD) countries (Figure 2.8). More than 90 percent of the global population exposed to floods live in South Asia, East Asia and the Pacific (Table 2.2), but exposure is growing most rapidly in sub-Saharan Africa. In contrast, exposure is increasing only marginally in OECD countries whereas in eastern and south-eastern Europe and Central Asia it is stable, reflecting a broader trend of demographic changes. Figure 2.8
Trend in flood exposure per income region as modelled 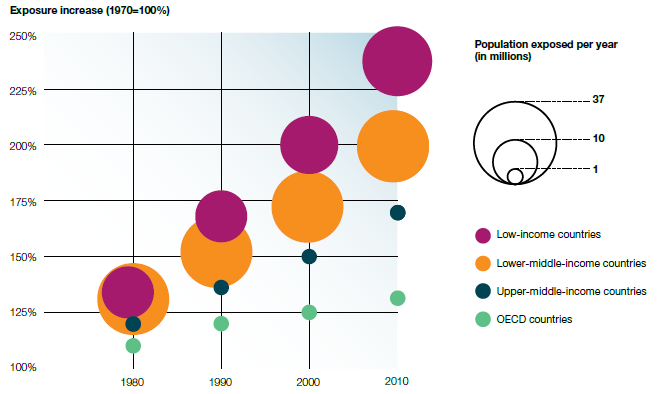
Table 2.2 Flood exposure by World Bank region as modelled9 (million people per year)
Since 1970 there has been little change in the overall number of tropical cyclones (Figure 2.9). The number of recorded Category 1 and 2 cyclones has been decreasing whereas the number of Category 4 and 5 cyclones has been increasing.10 Over half of all tropical cyclones that made landfall affected East Asia and the Pacific and OECD countries (mainly Japan, the United States of America and Australia) (Table 2.3). Although most of the annual average exposure to tropical cyclones is concentrated in lower-middle- and high-income countries, exposure is growing most rapidly in low-income countries (Figure 2.10) where it has increased almost eight-fold since the 1970s (the dip in exposure in the 1990s reflects fewer cyclones in that decade). Figure 2.9
Average annual number of tropical cyclones by Saffir-Simpson Category between 1970 and 2009 as observed 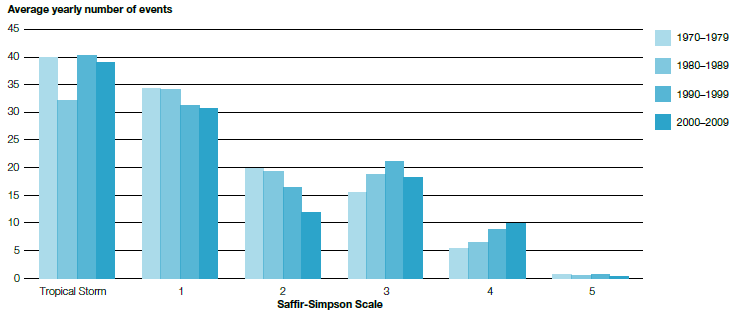
Table 2.3 Exposure to tropical cyclones by World Bank region as modelled from
observed events (in million people per year)
Figure 2.10
Trend in exposure to tropical cyclones per income region as observed 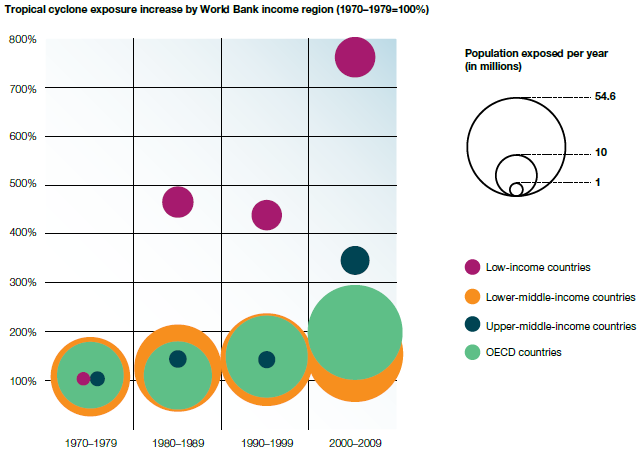
Notes 6
Small islands by definition often do not have ‘remote
rural areas’ but still can have high mortality risk. 7
This analysis focuses on major river basin flooding
(in watersheds with an area greater than 1,000 km2).
It does not include urban flooding, coastal flooding,
flash floods or glacial lake outburst floods (GLOFs), or
flooding on small islands. Nor does it take into account
the damages caused by winds during floods, which can
be substantial in some cases. 8
A completely new tropical cyclone dataset based on
newly available data (from IBTrACS, NOAA) was used
for this analysis (Peduzzi et al., 2011 Peduzzi, P., Chatenoux, B., Dao, H., De Bono, A., Herold, H., Kossin, J., Mouton, F. and Nordbeck, O. 2010. Global trends in human exposure, vulnerability and risk from tropical cyclones. JOURNAL (submitted). ), improving upon
on the analysis from GAR09.. 9
The other high-income economies (OHIE) region is
not included in this and the related tables and figures
because of the limited number of countries modelled
for floods and cyclones in this category. 10
Possibly due to climate change and warmer sea
temperatures, but possibly also because of changes in
recording instruments and methods (Landsea et al., 2006 Landsea, C., Harper, B., Hoarau, K. and Knaff, J. 2006. Can we detect trends in extreme tropical cyclones? Science 313 (5786): 452–454. ). With only short data series it is impossible to
confirm if this is a longer-term trend.Available at http://www.sciencemag.org/content/313/5786/452.short. 11
Tropical cyclone exposure (approximately 100,000
people in 2000–2009) in the Russian Far East has been
included in the EAP region. |

| |


 GAR 2011 Contributing Papers