

 |
Global Assessment Report on Disaster Risk Reduction 2011
Revealing Risk, Redefining Development |
  |
 Chapter 3 Drought risksUnlike the risks associated with tropical cyclones and floods, those associated with drought remain less well understood. Drought, therefore, is often a less visible risk. Losses and impacts are not systematically captured, global standards for measuring drought hazard are only slowly being introduced, and there are difficulties regarding data collection. As a result, comprehensive assessments of drought risks are only just beginning and, as yet, there is no credible global drought risk model. Case studies indicate that the impacts of drought can only be partly attributed to deficient or erratic rainfall, as drought risk appears to be constructed over time by a range of drivers. These include: poverty and rural vulnerability; increasing water demand due to urbanization, industrialization and the growth of agribusiness; poor soil and water management; weak or ineffective governance; and climate variability and change. Such drivers are increasing vulnerability and exposure, and translate drought hazard into risk. Impacts and drivers may be strongly interrelated but, as many relate to poor, rural households, there is currently little political or economic incentive to address the risk. Yet, strengthening drought risk management, as an integral part of risk governance, will be fundamental to sustaining the quality of life in many countries during the coming decades. This chapter is only a first step in presenting the complexities of global drought risk. Understanding and revealing the full spectrum is a challenge that must be addressed in the years to come. 3.1 Drought risk in the Navajo Nation
The dramatic case of the Navajo
Nation in the south-western United
States of America shows that much
of what are characterized as drought
impacts are only partly due to lack
of rainfall. Factors including political
marginalization and rural poverty have
helped to translate meteorological
drought into a widespread disaster for
the entire people.
Between 1999 and 2009, the Navajo Nation experienced a drought of historic proportions. Many springs sampled for a 1999 water-quality study had run dry by 2002 and have remained dry ever since. Wells and aquifers became so saline that they could no longer be used for drinking, by humans or livestock. More than 30,000 cattle perished between 2001 and 2002 alone, and entire communities ran out of water (  Redsteer et al., 2010 Redsteer et al., 2010 Redsteer, M.H., Kelley, K.B., Francis, H. and Block, D. 2010. Disaster risk assessment case study: Recent drought on the Navajo nation, southwestern United States. Background Paper prepared for the 2011 Global Assessment Report on Disaster
Risk Reduction. Geneva, Switzerland: UNISDR. Redsteer, M.H., Kelley, K.B., Francis, H. and Block, D. 2010. Disaster risk assessment case study: Recent drought on the Navajo nation, southwestern United States. Background Paper prepared for the 2011 Global Assessment Report on Disaster
Risk Reduction. Geneva, Switzerland: UNISDR.Click here to view this GAR paper. Figure 3.1
Navajo Nation and its historic stream-flow 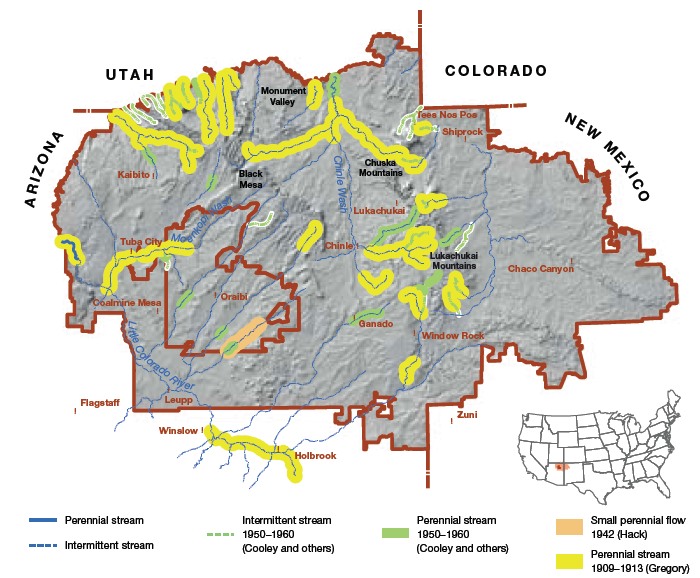 Some of the causes of this disaster were not directly due to decreasing rainfall during the drought period. Annual snowfall has been decreasing during the past 80 years (Figure 3.2), and by the 1960s more than 30 major rivers and bodies of water upon which the Navajo relied for livestock and agricultural production had dried up (Figure 3.1) ( Redsteer et al., 2010 Redsteer, M.H., Kelley, K.B., Francis, H. and Block, D. 2010. Disaster risk assessment case study: Recent drought on the Navajo nation, southwestern United States. Background Paper prepared for the 2011 Global Assessment Report on Disaster
Risk Reduction. Geneva, Switzerland: UNISDR.Click here to view this GAR paper. Weiss, J., Castro, C. and Overpeck, J. 2009. Distinguishing pronounced droughts in the southwestern United States: Seasonality and effects of warmer temperatures. Journal of Climate 22 (22): 5918–5932. ).Available at http://dx.doi.org/10.1175/2009JCLI2905.1. Figure 3.2
Average annual snowfall at 25 weather stations on or near the Navajo Nation (1930–2010) 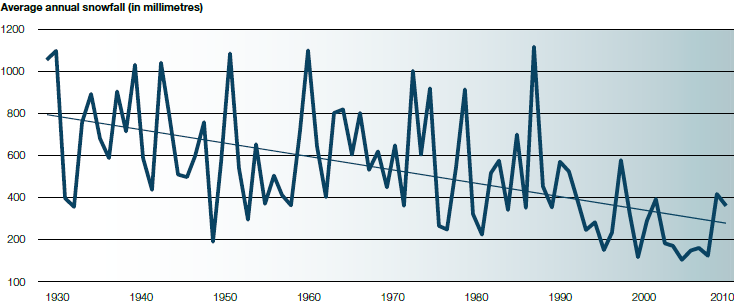
(Source:
Redsteer et al., 2010 Redsteer, M.H., Kelley, K.B., Francis, H. and Block, D. 2010. Disaster risk assessment case study: Recent drought on the Navajo nation, southwestern United States. Background Paper prepared for the 2011 Global Assessment Report on Disaster
Risk Reduction. Geneva, Switzerland: UNISDR.Click here to view this GAR paper. However, it was factors like political marginalization and rural poverty that translated meteorological drought into a disaster for the Navajo people. The Navajo reservation was established in 1868 in a vast and remote region spanning four states (Arizona, Colorado, New Mexico and Utah). The majority of the reservation occupies the driest third of the Navajo’s traditional homeland, because ranchers had claimed the best rangelands for themselves ( Redsteer et al., 2010 Redsteer, M.H., Kelley, K.B., Francis, H. and Block, D. 2010. Disaster risk assessment case study: Recent drought on the Navajo nation, southwestern United States. Background Paper prepared for the 2011 Global Assessment Report on Disaster
Risk Reduction. Geneva, Switzerland: UNISDR.Click here to view this GAR paper. Young, R. 1961. The Navajo yearbook: 1951–1961: A decade of progress. Window Rock, USA: Navajo Agency. ; White, 1983. White, R. 1983. The roots of dependency: Subsistence, environment, and social change among the Choctaws, Pawnees and Navajos. Lincoln, USA: University of Nebraska Press. ;
Kelley and Whiteley, 1989. Kelley, K., Whiteley, P. 1989. Navajoland: Family settlement and land use. Tsaile, USA: Navajo Community College Press. ). This final restriction
interrupted a traditional Navajo drought impact
management practice of moving livestock across
district boundaries to less drought affected
areas (White, 1983. White, R. 1983. The roots of dependency: Subsistence, environment, and social change among the Choctaws, Pawnees and Navajos. Lincoln, USA: University of Nebraska Press. ; Kelley and Whiteley, 1989. Kelley, K., Whiteley, P. 1989. Navajoland: Family settlement and land use. Tsaile, USA: Navajo Community College Press. ;
Iverson, 2002. Iverson, P. 2002. Letters from 1936-1947 pertaining to livestock reduction and grazing districts. In: For our Navajo people: Diné letters, speeches, and petitions 1900–1960. Albuquerque, USA: University of New Mexico Press. ). Some Navajo traditions and
practices also increased drought risk, such as
their continued preference of cattle over other
species, added to by US Government and
Navajo Nation policies that require families to
have livestock in order to validate traditional
land use rights, even if they have lived on the
same land for generations (. Redsteer et al., 2010 Redsteer, M.H., Kelley, K.B., Francis, H. and Block, D. 2010. Disaster risk assessment case study: Recent drought on the Navajo nation, southwestern United States. Background Paper prepared for the 2011 Global Assessment Report on Disaster Risk Reduction. Geneva, Switzerland: UNISDR.Click here to view this GAR paper. Young, R. 1961. The Navajo yearbook: 1951–1961: A decade of progress. Window Rock, USA: Navajo Agency. ; . Redsteer et al., 2010 Redsteer, M.H., Kelley, K.B., Francis, H. and Block, D. 2010. Disaster risk assessment case study: Recent drought on the Navajo nation, southwestern United States. Background Paper prepared for the 2011 Global Assessment Report on Disaster
Risk Reduction. Geneva, Switzerland: UNISDR.Click here to view this GAR paper. Such policies in a context of decreasing water availability led to endemic poverty even before the last drought began. In 1997, average annual per capita income was less than US$6,000, and 60 percent of the Navajo lived in poverty, in houses without water and electricity. Savings mitigate drought impacts, but because the Navajo often invest their savings in livestock, this safety net is in itself vulnerable to drought ( Redsteer et al., 2010 Redsteer, M.H., Kelley, K.B., Francis, H. and Block, D. 2010. Disaster risk assessment case study: Recent drought on the Navajo nation, southwestern United States. Background Paper prepared for the 2011 Global Assessment Report on Disaster
Risk Reduction. Geneva, Switzerland: UNISDR.Click here to view this GAR paper. 3.2 Drought hazard
Meteorological drought is a climatic
phenomenon rather than a hazard
per se, but it is often confused with
other climate conditions to which
it is related, such as aridity. It only
becomes hazardous when translated
into agricultural or hydrological
drought, and these depend on other
factors, not just a lack of rainfall.
Box 3.1 Types of drought
There are three general types of drought:
meteorological, agricultural and hydrological.
Meteorological drought refers to a
precipitation deficit over a period of time.
Agricultural drought occurs when soil
moisture is insufficient to support crops,
pastures and rangeland species. Hydrological
drought occurs when below-average water
levels in lakes, reservoirs, rivers, streams
and groundwater, impact non-agricultural
activities such as tourism, recreation, urban
water consumption, energy production and
ecosystem conservation. (Source: Wilhite and Buchanan-Smith, 2005 Wilhite, D.A. and Buchanan-Smith, M. 2005. Drought as hazard: Understanding the natural and social context. Drought and water crises: Science, technology, and management issues. In: D.A. Wilhite, ed. Volume 86. Books in Soils, Plants, and the Environment Series. Boca Raton, USA: Taylor & Francis, ; UNISDR, 2009.  UNISDR (United Nations International Strategy for Disaster Reduction). 2009. Global assessment report on disaster risk reduction: Risk and poverty in a changing climate. Geneva, Switzerland: United Nations International Strategy for Disaster Reduction. UNISDR (United Nations International Strategy for Disaster Reduction). 2009. Global assessment report on disaster risk reduction: Risk and poverty in a changing climate. Geneva, Switzerland: United Nations International Strategy for Disaster Reduction.Click here to go to GAR09 page. Meteorological droughts are usually defined as deficiencies in rainfall, from periods ranging from a few months to several years or even decades. Long droughts often change in intensity over time and may affect different areas. For example, the 1991–1995 meteorological drought in Spain migrated from west to east and then south (Figure 3.3). Figure 3.3
Average annual snowfall at 25 weather stations on or near the Navajo Nation (1930–2010) 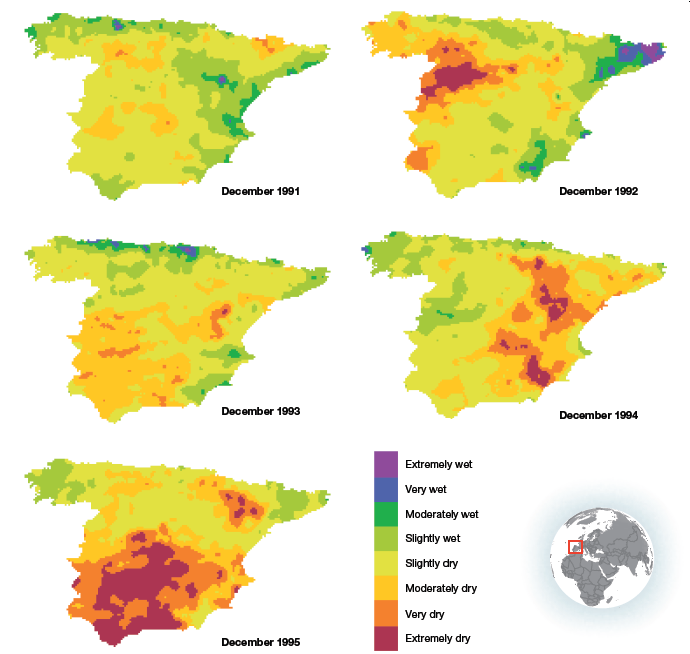
(Source:
Mestre, 2010 Mestre, A. 2010. Drought monitoring and drought management in Spain. Background Paper prepared for the 2011 Global Assessment Report on Disaster
Risk Reduction. Geneva, Switzerland: UNISDR.Click here to view this GAR paper. Until the recent adoption of the Standard Precipitation Index (SPI) (see Box 3.2), there was no agreed global standard to identify and measure meteorological drought. National weather services used different criteria, making it difficult to establish exactly when and where droughts occur. Box 3.1 Integrating disaster risk reduction into public investment in Latin America
Box 3.2 Measuring meteorological drought
The World Meteorological Organization (WMO) adopted the Standardized Precipitation Index (SPI) in 2009 as a global standard to measure meteorological droughts, via the ‘Lincoln Declaration on Drought Indices’. It is encouraging use by national meteorological and hydrological services in addition to other indices used in each region, and will be considered for acceptance by the World Meteorological Congress at its Sixteenth Session in June 2011. The Standardized Precipitation Index (McKee et al., 1993 McKee, T., Doesken, N. and Kleist, J. 1993. The relationship of drought frequency and duration to time scales. In: the 8th Conference on Applied Climatology, Anaheim, USA, 17–22 January, 1993. Boston, MA, USA: American Meteorological Society. , 1995) is a powerful, flexible and simple index based on rainfall data, and it can identify wet periods/cycles as well as dry periods/cycles. The SPI compares rainfall over a period – normally 1–24 months – with long-term mean precipitation at the same location (Guttman, 1994. Guttman, N. 1994. On the sensitivity of sample L moments to sample size. Journal of Climatology 7: 1026–1029. ; Edwards and McKee, 1997. Edwards, D. and McKee, T. 1997. Characteristics of 20th century drought in the United States at multiple time scales. Climatology Report No. 97-2. Fort Collins, USA: Colorado State University. ).. However, at least 20–30 years (optimally 50–60 years) of monthly rainfall data is needed to calculate the SPI (Guttman, 1994 Guttman, N. 1994. On the sensitivity of sample L moments to sample size. Journal of Climatology 7: 1026–1029. ). Given the lack of complete data series in many locations, and that many drought-prone regions have insufficient rainfall stations, interpolation techniques may need to be applied to temporal and geographic gaps. Table 3.1 shows how an SPI of 3 months can be used to calculate the probability of different levels of droughts severity.. Table 3.1 Drought probability using a 3-month Standardized Precipitation Index
Figure 3.4 shows the global distribution of meteorological dryness/wetness at the end of September 2010, using a 6-month SPI. This map highlights in red the droughts in Russia associated with wildfires (discussed in Chapter 1) and western Brazil, a normally humid climate. Figure 3.4
Interpolated global map using a 6-month Standardized Precipitation Index (April–September 2010) 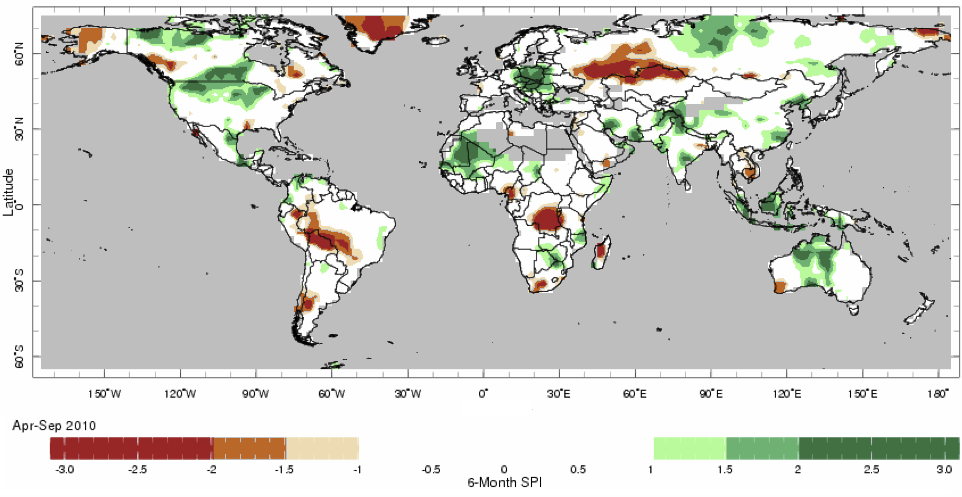
(Source: IRI, 2010
IRI (International Research Institute). 2010. 6-month SPI: April–September 2010. Palisades, USA: International Research Institute for Climate and Society, Columbia University. ). (Source: Sivakumar et al., 2010 Sivakumar, M.V.K., Wilhite, D., Svoboda, M. Hayes, M. and Motha, R. 2010. Drought risk and meteorological droughts. Background paper prepared for the 2011 Global Assessment Report on Disaster
Risk Reduction.Geneva, Switzerland: UNISDR.Click here to view this GAR paper. The application of the SPI could strengthen the capacity of countries to monitor and assess meteorological drought. Despite its simplicity, many countries have difficulty using it due to an insufficient number of rainfall stations in some areas, due to the low priority awarded to hazard monitoring in government budgets. The number of rainfall stations maintained by Spain’s national meteorological agency, AEMET, for example, has declined to almost half of the peak of the mid-1970s (Figure 3.5) ( Mestre, 2010 Mestre, A. 2010. Drought monitoring and drought management in Spain. Background Paper prepared for the 2011 Global Assessment Report on Disaster
Risk Reduction. Geneva, Switzerland: UNISDR.Click here to view this GAR paper. Figure 3.5
Average number of rainfall stations maintained by AEMET by year in Spain 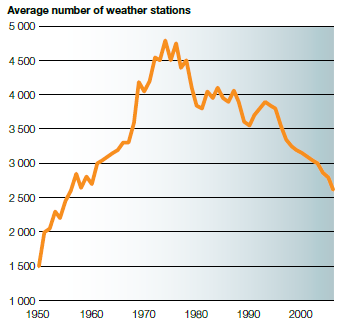
(Source:
Mestre, 2010 Mestre, A. 2010. Drought monitoring and drought management in Spain. Background Paper prepared for the 2011 Global Assessment Report on Disaster
Risk Reduction. Geneva, Switzerland: UNISDR.Click here to view this GAR paper. Figure 3.6
Distribution of weather stations in Central America 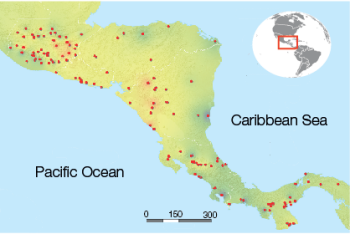
(Source:
Brenes Torres, 2010 Brenes Torres, A. 2010. Elementos y patrones constitutivos del riesgo de sequía en América Central. Background paper prepared for the 2011 Global Assessment Report on Disaster
Risk Reduction. Geneva, Switzerland: UNISDR.Click here to view this GAR paper. Brenes Torres, 2010 Brenes Torres, A. 2010. Elementos y patrones constitutivos del riesgo de sequía en América Central. Background paper prepared for the 2011 Global Assessment Report on Disaster
Risk Reduction. Geneva, Switzerland: UNISDR.Click here to view this GAR paper. Dai, A. 2010. Drought under global warming: A review. Wiley Interdisciplinary Reviews: Climate Change 2 (1): 45–65. ). Because meteorological drought is a
climatic phenomenon, rather than a hazard per
se, additional data is required to identify and
measure drought hazard.. Experts have now reached a consensus that agricultural drought should be measured using composite indices that consider rainfall, soil moisture, temperature, soil and crop type, streamflow, groundwater, snow pack, etc., as well as historical records of drought impacts (WMO, 2010 WMO (World Meteorological Organization). 2010. Experts recommend agricultural drought indices for improved understanding of food production conditions. Geneva, Switzerland: World Meteorological Organization. ).1 However, such indices require data that is
available only in a handful of countries at present,
mostly in North America and parts of Africa.
Work is also ongoing to identify indicators of
hydrological drought, but this is also challenged
by data constraints and modelling complexities.2 Available at http://www.chsegura.es/export/descargas/cuenca/sequias/escasez/docsdescarga/WMO_Summary_and_Recommendations_of_the_Meeting.pdf&rct=j&sa=U&ei=xmP_TJXQOoiUOoWRzLIM&ved=0CBQQFjAA&q=WMO+agricultural+drought+risk+recommendation+murcia&usg=AFQjCNHYSeMaovK2ruHOW. Notes 1 At a meeting in June 2010 convened by the World
Meteorological Organization and the United Nations
secretariat of the International Strategy for Disaster
Reduction hosted by the Hydrographic Confederation of Segura. (Proceedings available at http://www.usda.gov/oce/weather/Private/MurciaProceedings-FINAL_wCovers.pdf) 2 Work is underway to develop a composite hydrological
drought index that takes into account factors including
stream-flow, precipitation, reservoir levels, snow pack,
and groundwater levels. |

| |


 GAR 2011 Contributing Papers