

 |
Global Assessment Report on Disaster Risk Reduction 2011
Revealing Risk, Redefining Development |
  |
2.3 Extensive disaster risk trends
The past 20 years have seen an exponential increase in the number of local areas reporting losses, the number of houses damaged, the number of people affected, and the damage to health and educational facilities associated with extensive disasters. Increasing extensive risk is closely related to the challenges low- and middle-income countries face in addressing underlying risk drivers and reducing vulnerability.
Extremely heavy and persistent rains fell across a broad area of the Central Valley and Pacific coast of Costa Rica on 2–3 November 2010. Just south of San José, a mudslide destroyed the small community of Calle Lajas in San Antonio de Escazú, killing 23 people and destroying 25 houses. The losses in Calle Lajas, however, were only the most intensive of those associated with a large number of floods and landslides that affected 50 municipalities and 681 communities in Costa Rica. The disaster damaged or destroyed 2,540 houses (Figure 2.19), four schools and 85 bridges (CNE, 2010 CNE (Comisión Nacional de Prevención de Riesgos y Atención de Emergencias). 2010. Resumen parcial no. 7 al 8 de noviembre, 2010. impacto de lluvias intensas baja presión e interacción huracán tomás. San José, Costa Rica: Comisión Nacional de Prevención de Riesgos y Atención de Emergencias. ).. Figure 2.19
Number of houses damaged in different municipalities as a result of the November 2010 rains in Costa Rica 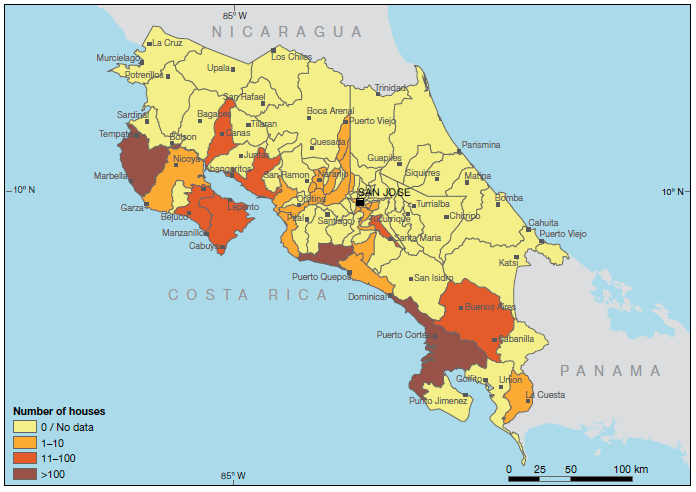 Whereas these disasters were characterized as a consequence of unexpectedly heavy rains, in reality they were the outcome of an unseen but continuous accumulation of risk. Costa Rica is ranked 59th out of 184 countries on risk governance capacities (Lavell et al., 2010 Lavell, C., Canteli, C., Rudiger, J. and Ruegenberg, D. 2010. Data spread sheets developed in support of the DARA 'risk reduction index: Conditions and capacities for risk reduction'. Geneva, Switzerland: UNISDR. ), ahead
of most low- and middle-income countries.
However, many municipalities do not have land
use plans informed by risk assessments, and
over the years building and urban development
have been authorized in many hazard-prone
locations. Although Costa Rica has good
levels of environmental protection, it is having
difficulty managing rapidly increasing hazard
exposure from urban development, and ensuring
the security of public infrastructure such as
roads and bridges.. It was anticipated that the 2010 rainy season would be more intense than usual given the presence of La Niña15 in the region. Although a scientific study had already identified the risk of landside in Calle Lajas, local authorities were unable to address this because of a combination of ineffective planning and enforcement mechanisms, responsibilities spread over many different public bodies with unclear accountability, and a resistance to relocation from many of the households at risk.16 Figure 2.20
Mortality from extensive and intensive disasters, 1989–2009 in 20 countries17 in Africa, Asia, Latin America and the Middle East 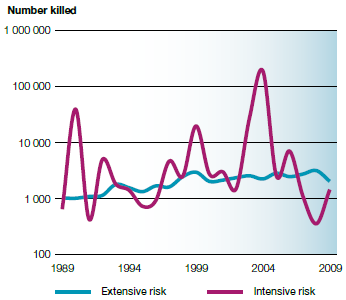
First, although extensive disasters are responsible for only a small proportion of global disaster mortality (Figure 2.20), they account for a very significant proportion of damage to public assets, such as health and educational facilities and infrastructure, as well as to the livelihoods, houses and assets of low-income groups. Many countries are making progress in systematically recording disaster loss, but most extensive disaster losses go unaccounted for (see Box 2.4). The invisibility of such a high proportion of disaster loss is one reason why so many countries find it politically and economically difficult to prioritize investments in DRM. Box 2.4 Updating the extensive risk analysis
To improve the analysis of extensive risk, GAR11 has incorporated substantial new data. All the
databases of GAR09 have been updated to include disaster loss data for 2008 and 2009, and nine
new countries have contributed data for the analysis (Chile, El Salvador, Guatemala, Indonesia, Jordan,
Mozambique, Panama, Syrian Arab Republic and Yemen). The dataset (see Table 2.6) now includes
almost 200,000 local level disaster reports covering a 40-year period from 20 countries: Argentina,
Bolivia, Colombia, Costa Rica, Ecuador, India (Orissa and Tamil Nadu), Iran (Islamic Republic of),
Mexico, Nepal, Peru and Venezuela in addition to the nine new countries. Combined, these countries
and states comprised a population of more than 850 million people in 2009. ‘Extensive’ and ‘intensive’ risks are relative terms. As such, any quantitative threshold between extensive and intensive manifestations of risk is arbitrary no matter the scale. Given that each country or locality has a unique risk footprint, hybrid loss exceedance curves would be most appropriate to define what is extensive or intensive in any given country (see Box 5.3 for more information). At present, such curves have only been constructed for three of the countries in the data universe (Colombia, Mexico and Nepal). For the purpose of this analysis of 21 countries and states, a statistically robust quantitative threshold was calculated for the data universe as a whole, rather than for individual countries or regions, and was used to filter the most intensive manifestations of risk. The threshold for intensive risk used in GAR11 was established at 25 deaths or 600 houses destroyed in any one local level loss report (  Freire, 2010 Freire, 2010 Freire, C. 2010. Extensive risk of the impact of disasters. Background paper prepared for the 2011 Global Assessment Report on Disaster
Risk Reduction. Geneva, Switzerland: UNISDR. Freire, C. 2010. Extensive risk of the impact of disasters. Background paper prepared for the 2011 Global Assessment Report on Disaster
Risk Reduction. Geneva, Switzerland: UNISDR.Click here to view this GAR paper. OSSO, 2011a OSSO (Southwestern Seismological Observatory). 2011a. Extensive risk analysis for the 2011a Global Assessment Report on Disaster Risk Reduction: Metodología para la identification de Umbrales. Background Paper prepared for the 2011 Global Assessment Report on Disaster
Risk Reduction. Geneva, Switzerland: UNISDR.Click here to view this GAR paper. The analysis showed that extensive risk accounts for only 9.6 percent of the deaths and 20 percent of the houses destroyed (a proxy for direct economic loss). Damage is much more extensively spread, with extensive risk accounting for 53.9 percent of houses damaged, 80 percent of people affected, 83.1 percent of people injured, 45.2 percent of damage to schools, and 55.2 percent of damage to health facilities. Table 2.6 Summary of the GAR11 loss data universe
Second, as highlighted in Section 2.2, economic loss risk is increasing because countries have been unable to strengthen their risk governance capacities fast enough to address the rapidly increasing exposure that accompanies economic growth. Analysing extensive risk provides a unique real-time view of this challenge. Extensive risk, along with many of the localized weather-related hazards with which it is associated, is directly constructed by risk drivers such as badly planned and managed urbanization, environmental degradation, and poverty. Given that almost all (97 percent) of extensive disaster loss reports are weatherrelated, extensive risk analysis also provides an opportunity to view the impact of climate variability. Extensive risk, unlike intensive risk, is not dependent on the location of earthquake fault lines or cyclone-prone coastlines. The Central American countries of Costa Rica, El Salvador, Guatemala and Panama illustrate this issue, where extensive risk exists wherever development occurs (Figure 2.21). All Panama’s municipal areas report extensive disaster losses even though the country lies south of the Caribbean hurricane belt and earthquakes are infrequent. Figure 2.21
Number of reports of extensive disaster loss in Costa Rica, El Salvador, Guatemala and Panama 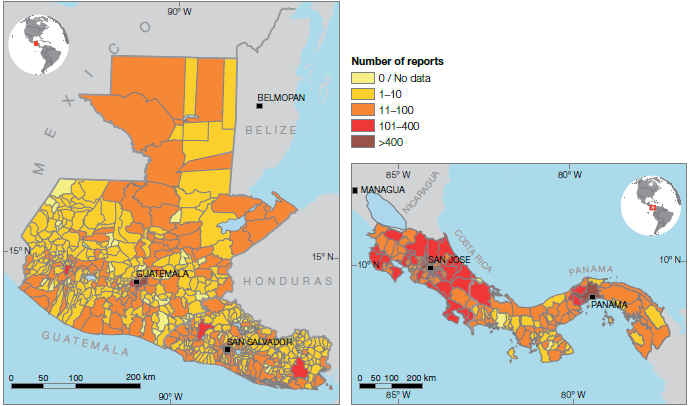 Third, and precisely because it reflects risk construction processes in operation, extensive risk is also an indicator of new intensive risk hotspots. As illustrated in the case of Dhaka, increased seasonal flooding is also an indicator of growing intensive earthquake risk. Globally, the analysis of new and updated local disaster loss data from a wider geographical sample of countries in Africa, Asia, Latin America and the Middle East (see Box 2.5) confirms the trends first identified in 2009 (UNISDR, 2009  UNISDR (United Nations International Strategy for Disaster Reduction). 2009. Global assessment report on disaster risk reduction: Risk and poverty in a changing climate. Geneva, Switzerland: United Nations International Strategy for Disaster Reduction. UNISDR (United Nations International Strategy for Disaster Reduction). 2009. Global assessment report on disaster risk reduction: Risk and poverty in a changing climate. Geneva, Switzerland: United Nations International Strategy for Disaster Reduction.Click here to go to GAR09 page. Box 2.5 Progress in recording local level disaster impacts and losses
In the past two years, a number of countries have made significant progress in developing information systems to systematically record and document disaster loss. The Indonesian Disaster Data and Information Management Database (DIBI) is based on official government data from 1815 to 2009. DIBI is already being used as the basis for national policy, planning and budgeting in disaster risk reduction and is informing development planning decisions. For example, Indonesia’s National Disaster Management Agency (BNPB) has used DIBI to identify hazard-prone areas across Indonesia in order to prioritize the creation of district level disaster reduction structures. Within Indonesia’s National Development Planning Agency (BAPPENAS), the Directorate for Poverty Eradication is using DIBI to establish priorities for its own and donor-funded programmes. Ongoing work to improve DIBI includes incorporating additional attributes such as school-age children, health status, infrastructure, public facilities, income levels, types of livelihoods and spatial planning data. DIBI has also been used for pioneering applications in risk assessment, applying the methodology used in the GAR global risk model at the sub-national level (Figure 2.22). Figure 2.22
Landslide risk in Indonesia 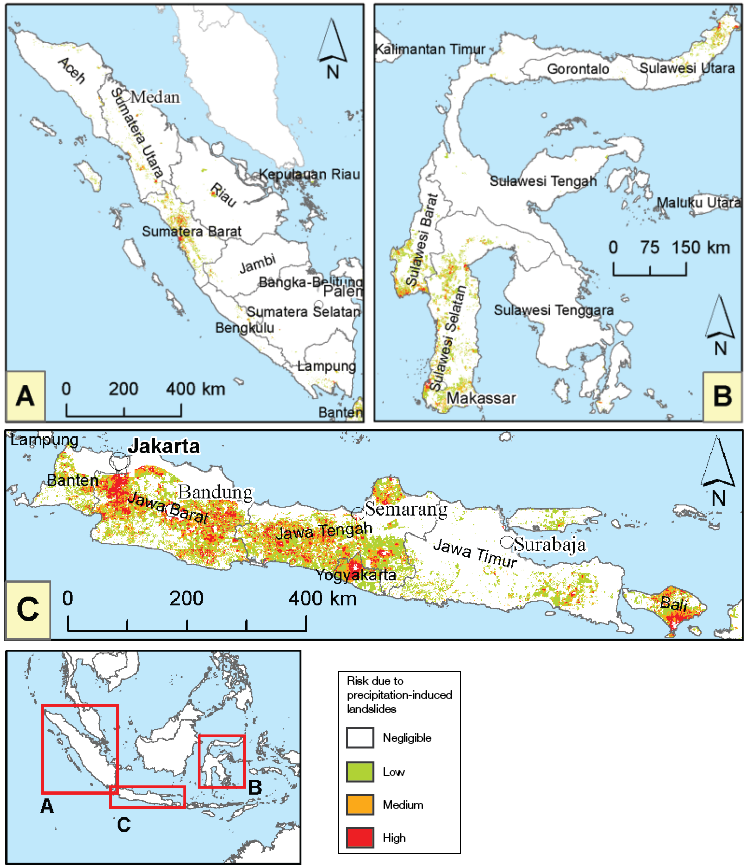
(Source: Cepeda et al., 2010 Cepeda, J., Smebye, H., Vangelsten, B., Nadim, F. and Muslim, D. 2010. Landslide risk in Indonesia. Background paper prepared for the 2011 Global Assessment Report on Disaster
Risk Reduction. Prepared by the International Centre for Geohazards, Norwegian Geotechnical Institute. Geneva, Switzerland: UNISDR.Click here to view this GAR paper. The Mozambique National Disaster Database, built and hosted by the government’s National Institute for Disaster Management (INGC) has the best documented set of reports of agricultural losses in the entire data universe. About 30 percent of its records (1,394) contain detailed information on the area and type of crops destroyed and affected. These records provide unique insight into how extensive risk manifests in the agricultural sector and affects rural livelihoods. In 2010, Egypt, Jordan, Morocco, the Syrian Arab Republic and Yemen also began a pioneering initiative to collect local level disaster loss data in the Arab states, where until then, the absence of systematic information on disaster impacts had been a major obstacle to strengthening capacities for disaster risk reduction. Jordan, the Syrian Arab Republic and Yemen (Figure 2.23) have recently published national disaster inventories, included in GAR11, and it is expected that the other two countries will soon follow. Mozambique and the Arab states also plan to include age- and gender-enabled indicators when such information is available. Figure 2.23
Housing damage by governorate in Jordan and the Syrian Arab Republic (left), and by province in Yemen (right), 1989–2009 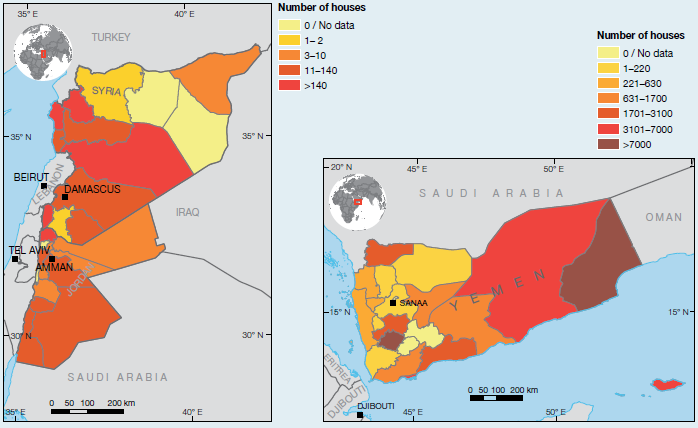 Viet Nam has been collecting comprehensive disaster loss data as part of the DANA initiative of the Central Committee of Flood and Storm Control. The database contains historical data at the provincial level dating back to 1989, and was used to assess disaster impacts on children in Chapter 2 (Tarazona and Gallegos, 2010; Viet Nam 2011). Latin America has been recording local level disaster loss data since the mid-1990s. Until recently, countries in this region (with the exception of Panama) struggled to institutionalize these loss databases. In the past two years, however, regional organizations as well as governments in Bolivia, Ecuador, El Salvador and Guatemala have made progress on institutionalizing systematic disaster reporting and analysis. Notes 15
El Niño is a phenomenon in the equatorial Pacific
Ocean characterized by a positive sea surface
temperature departure from normal (for the 1971–
2000 base period) greater than or equal in magnitude
to 0.5 degrees Celsius, averaged over three consecutive
months. La Niña is phenomenon in the same region
characterized by a negative sea surface temperature
departure from normal greater than or equal in
magnitude to 0.5 degrees Celsius, averaged over three
consecutive months (NOAA, 2003 NOAA (National Oceanic and Atmospheric Administration). 1998. Mitch: The deadliest Atlantic hurricane since 1780. Washington DC, USA: National Oceanic and Atmospheric Administration. ).. 16
A statement released by the municipal authorities of
Escazu highlights these issues (Segura et al., 2010). 17
Argentina, Bolivia, Chile, Colombia, Costa Rica,
Ecuador, El Salvador, Guatemala, India (Orissa and
Tamil Nadu), Indonesia, Iran (Islamic Republic of ),
Jordan, Mexico, Mozambique, Nepal, Peru, Panama,
Syrian Arab Republic, Venezuela and Yemen. |

| |


 GAR 2011 Contributing Papers