

 |
Global Assessment Report on Disaster Risk Reduction 2011
Revealing Risk, Redefining Development |
  |
Chapter 1 Introduction1.1 Unveiling disaster risk Earthquakes, tsunamis, tropical cyclones, floods and droughts are physical events which can be measured and modelled. But while their causes and impacts are increasingly well understood, the escalating losses associated with these events indicate that most governments have yet to find effective ways of reducing and managing the risks they pose. Father José de Cevallos was adamant. The earthquake, tsunami and fires that destroyed Lisbon in 1755 were natural events. In contrast, the earthquake and tsunami that destroyed Lima and its port of Callao in 1746 were acts of God, divine retribution for Callao’s libertine population (Walker, 2008 Walker, C. 2008. Diálogos con el Perú, ensayos de historia. Lima, Peru: Fondo Editorial del Pedagógico San Marcos. ). In an early example of disaster research, the conclusions of the Augustine priest, based on a study of ancient, biblical and contemporary references, were published in 1757, in Seville, Spain.. The destruction of one of the most important cities in the Americas together with a major European capital in a space of only nine years seriously disrupted the economies of Spain and Portugal, and led to intense debate on the causes of such disasters. The twin catastrophes of Lima-Callao and Lisbon marked a turning point in the way disasters were looked at and understood. Historical evidence shows that societies have always incorporated a degree of risk management into their technological systems, urban infrastructure and cosmology. In Peru, for example, the Chimu culture portrayed the social and economic impacts of El Niño on vast adobe tapestries in the coastal city of Chan Chan (Pillsbury, 1993 Pillsbury, J. 1993. Sculpted friezes of the empire of Chimor. PhD Thesis. New York, USA: Columbia University. ). Cuneiform tablets from the 17th century BC explain Babylonian cosmology and history via the epic of Atrahasis, a Noah-like hero who survived repeated floods (Lambert et al., 1969Available at http://digitalcommons.libraries.columbia.edu/dissertations/AAI9333834. Lambert, W-G., Millard, A-R. and Civil, M. 1969. Atra-hasis: The Babylonian story of the flood. Oxford, UK: Clarendon Press. ; Dalley, 1989. Dalley, S. 1989. Myths from Mesopotamia: Creation, the flood, Gilgamesh, and others. Oxford, UK: Oxford University Press. ). The Western Zhou of China interpreted disasters as signs that their rulers had lost Heaven’s mandate (Shaughnessy and Loewe, 1999. Shaughnessy, E-L., and Loewe, M. 1999. The Cambridge history of ancient China : From the origins of civilization to 221 B.C. Cambridge, UK: Cambridge University Press. ). . Four hundred years before the destruction of Lima-Callao and Lisbon, the North African philosopher and historian Ibn Khaldun was already theorizing on the relationships between nature, physical hazards, development and political systems (Ibn Khaldun et al., 1989 Ibn Khaldūn. 1967. The Muqaddimah: An introduction to history, F. Rosenthal, trans., N. Dawood, ed. Princeton, USA: Princeton University Press. ). But this was an isolated case. It was only in the 18th century AD that an era of scientific enquiry into the causes of natural disasters was truly ushered in. The destruction of Lisbon inspired Voltaire to ridicule the view of a world overseen by a benevolent and omnipotent deity, in Candide published in 1759. Kant also wrote some of the first papers of this period speculating on the natural causes of earthquakes, while Rousseau started to identify the social causes of risk.. Box 1.1 A tale of two disasters
On the evening of 28 October 1746, Lima was shaken by a violent earthquake. Out of a population of 50,000, only about 1,000 people died. But at about 11 pm, a tsunami devastated the neighbouring port of Callao, destroying the port itself and sweeping miles inland. In contrast to Lima, only a handful of Callao’s 6,000 inhabitants survived.
Lima was then the most important city in South America, and the port of Callao exported gold and silver to Spain. The disaster was unprecedented for the Spanish in the region, and posed a critical economic threat to the colonial power. The Viceroy of Peru, José Antonio Manso de Velasco, was given orders to rebuild Lima as soon as possible. An efficient administrator, he rapidly restored order. His reconstruction plan, designed by French mathematician Louis Godin, was published in early 1747 and included detailed proposals to reduce vulnerability by widening streets and lowering building height. Unfortunately, Manso de Velasco lacked the political authority to overcome opposition to the plan from Lima’s aristocracy and religious authorities, and Spain never provided the required tax relief and financing needed for the reconstruction. Godin’s proposal to restrict building height to one story was abandoned, as was the Viceroy’s intention to reduce the number of monasteries and convents in the city. As a compromise, the authorities permitted the rebuilding of second floors with earth-rendered bamboo rather than adobe bricks, a measure that greatly reduced future earthquake losses in the city. Nine years later, on the morning of 1 November 1755, Lisbon was struck by a catastrophic earthquake followed by a tsunami and fires, which caused its near total destruction. It is estimated that between 30,000 and 40,000 of Lisbon’s population of 200,000 lost their lives, and that 85 percent of the city’s buildings were destroyed. Unlike Manso de Velasco in Lima, the Prime Minister of Portugal, the Marques of Pombal, had far greater political authority and was able to repress religious opposition to his reconstruction plan. Explicitly accepting that the earthquake and tsunami had natural causes, Pombal used the reconstruction process to radically reorganize the city, giving it a more rational layout that reinforced secular rather than religious power. Figure 1.1 Callao, Peru, before and after the 1746 tsunami: the left hand map shows Callao before the tsunami while the right hand map shows the new fortress that was built in Callao surrounded by the remains of the city walls 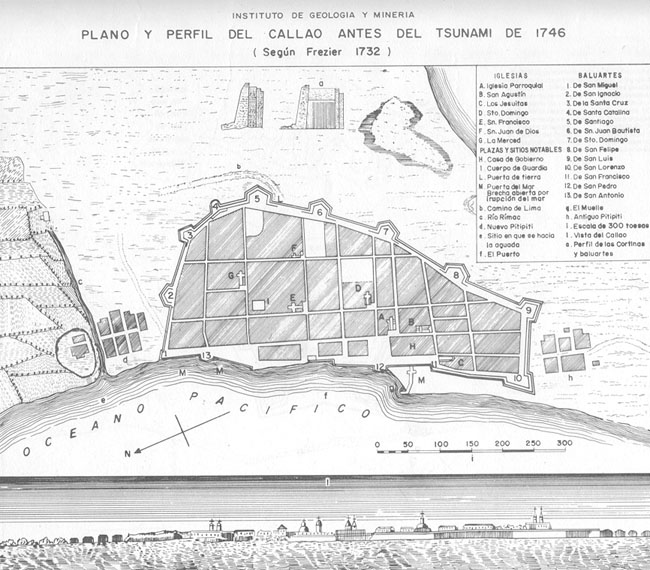 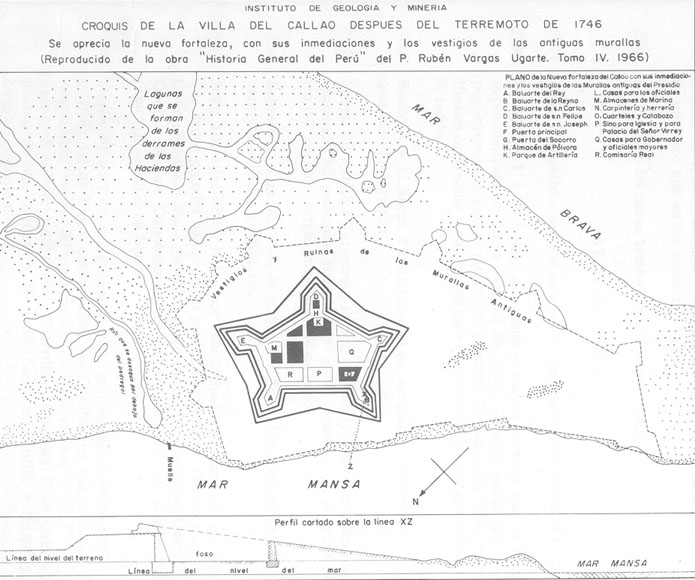
(Source: Pérez-Mallaína, 2008 Pérez-Mallaína, P.E. 2008. Las otras secuelas de una catástrofe natural: Tensiones sociales e ideólogicas en lima tras el terremoto de 1746. In: Historia y desastres en américa latina, volumen III, V. García Acosta, ed., 187-228. Mexico City and Panama City: Centro de Investigaciones y Estudios Superiores en Antropología Social (CIESAS)/Red de Estudios Sociales en Prevención de Desastres en América Latina (La Red). ; Walker, 2008. Walker, C. 2008. Diálogos con el Perú, ensayos de historia. Lima, Peru: Fondo Editorial del Pedagógico San Marcos. ). Another two hundred years passed before tectonic plate theory became scientific orthodoxy. This and other discoveries gradually led to today's acceptance that earthquakes, tsunamis, tropical cyclones, floods and droughts are physical events that can be measured and modelled. Whereas physical hazards are increasingly well understood, the escalating losses associated with them indicate that contemporary societies still find it difficult to prevent hazards from becoming disaster risks. Peru and Indonesia, for example, are among the countries that could be hit by a devastating once-in-500-years tsunami with a height of more than six metres (UNISDR, 2009  UNISDR (United Nations International Strategy for Disaster Reduction). 2009. Global assessment report on disaster risk reduction: Risk and poverty in a changing climate. Geneva, Switzerland: United Nations International Strategy for Disaster Reduction. UNISDR (United Nations International Strategy for Disaster Reduction). 2009. Global assessment report on disaster risk reduction: Risk and poverty in a changing climate. Geneva, Switzerland: United Nations International Strategy for Disaster Reduction.Click here to go to GAR09 page. Stocks of risk and risk constructionAll governments are responsible for assets, some of which will be risk-prone. Governments have explicit responsibility for the safety of publicly owned assets, including schools, hospitals and clinics, water supplies, sanitation, electricity grids, communication networks, roads, bridges and other parts of the national infrastructure. At the same time, they have a responsibility for protecting the lives, livelihoods and uninsured private assets of households and communities after disasters.This stock of risk-prone assets is socially constructed, often over long periods by layers of decisions and consequent investments by individuals, households, communities, private businesses and the public sector, to different degrees and at different scales (Maskrey, 1996 Maskrey, A. 1996. Terremotos en el trópico húmedo: La gestión de los desastres del alto mayo, Perú (1990 y 1991), Limón, Costa Rica (1991), y Atrato Medio, Colombia (1992). Rugby, UK: ITDG Publishing. ; Oliver-Smith, 1999. Oliver-Smith, A. 1999. The 500 year earthquake: Vulnerability in a cultural context. In: The Angry Earth: Disaster in Anthropological Perspective, A. Oliver-Smith, ed. London, UK: Routledge. ). Physical hazards may be modified accordingly: for example, a decision to drain wetlands may increase the occurrence of flooding in a city downstream. The number of people and the value of assets exposed may increase due to decisions to locate economic and urban development in hazard-prone areas. Low-income urban households living in flood-prone areas may accept vulnerability to flooding as the ‘least bad’ of a set of heavily constrained options. . Whereas public investment usually represents only a small proportion of total investment in a country (UNFCCC, 2007 UNFCCC (United Nations Framework Convention on Climate Change). 2007. Investment and financial flows to address climate change. Bonn, Germany: Secretariat of the United Nations Framework Convention on Climate Change. ), governments play a key role in shaping these risk construction processes through their own investments in infrastructure and public services, and through planning and regulation. Public investment is particularly important for the welfare of low-income households and communities, whose risk is often characterized by structural poverty and a deficit of services and infrastructure. . As new development decisions and investments interact with the existing stock of public risk, they have impacts which may not be immediately apparent. It may be years or even decades before these impacts manifest, in loss of life, destroyed livelihoods, or damaged infrastructure. If these losses go unmanaged, they may have further and longer-term effects such as increasing poverty, declining human development and reduced economic growth. Extensive risksThe vast majority of these losses and impacts are extensive in character, occurring throughout a country’s territory (Figure 1.2). As risk accumulates over time, it manifests as a large and rising number of localized disasters, mainly associated with storms, flooding, fires and landslides, and linked to climate variability. These localized disasters may account for only a small proportion of overall disaster mortality but, closely mirroring development processes (UNISDR, 2009UNISDR (United Nations International Strategy for Disaster Reduction). 2009. Global assessment report on disaster risk reduction: Risk and poverty in a changing climate. Geneva, Switzerland: United Nations International Strategy for Disaster Reduction.Click here to go to GAR09 page. Figure 1.2
Houses damaged and destroyed in extensive disasters in Indonesia, 1970-2009 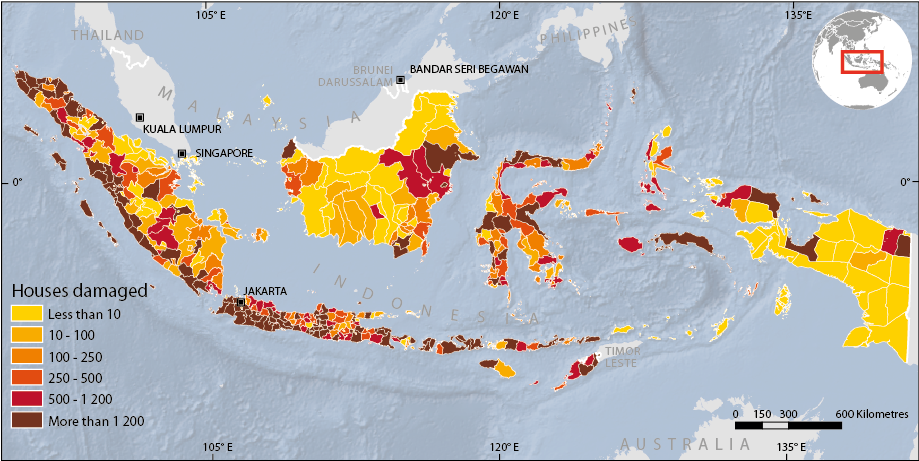
(Source: DIBI, 2010 DIBI (Data dan Informasi Bencana Indonesia). 2010. Data & Informasi Bencana Indonesia. Jakarta, Indonesia: Badan Bangsa Dalam Menghadapi Bencana (BNPB).. )Intensive risksWhen extensive risk accumulates in areas prone to major hazards, such as earthquakes, tsunamis, tropical cyclones or flooding in large river basins, it paves the way for infrequent but highly destructive intensive disasters. Disasters, such as those associated with the 2010 earthquake in Haiti which reportedly killed 222,517 people and injured another 310,928 (UNOCHA, 2010UNOCHA (United Nations Office for the Coordination of Humanitarian Affairs). 2010. Haiti situation report 19. New York, USA: United Nations Office for the Coordination of Humanitarian Affairs. ), or Hurricane Katrina in the USA in 2005 which caused losses estimated at US$125 billion (EM-DAT, 2011a. EM-DAT 2011a. Disaster country profile: United States. Brussels, Belgium: Université Catholique de Louvain. ), are responsible for the vast majority of global mortality and direct economic loss, but only occur relatively infrequently in any one place. The 2009 Global Assessment Report (UNISDR, 2009. UNISDR (United Nations International Strategy for Disaster Reduction). 2009. Global assessment report on disaster risk reduction: Risk and poverty in a changing climate. Geneva, Switzerland: United Nations International Strategy for Disaster Reduction.Click here to go to GAR09 page. Hazard and risk estimates, largely produced by and for the insurance industry, provide increasingly sophisticated models of the probable maximum losses associated with major hazards. Other studies identify areas where, for example, major earthquakes could occur (Aon Benfield, 2010 Aon Benfield UCL. 2010. When the earth moves. Mega-earthquakes to come? Chicago, USA: Aon BenfieldUCL Hazard Research Center. ). As this information becomes more widely available to governments, there are fewer and fewer excuses to be as unprepared as Manso de Velasco or the Marques of Pombal in 18th century Lima and Lisbon.. Nonetheless, there are still important gaps in our knowledge. In 1356, a strong earthquake destroyed Basel, Switzerland, but historical and instrumental records do not go back far enough to provide a reliable guide to the largest earthquakes that could occur in Central Europe (Stewart, 2003 Stewart, I. 2003. Issues in risk science 1: A rift at the heart of Europe reassessing large earthquake potential in NW Europe. London: Benfield Grieg Hazard Research Centre, Department of Earth Sciences, University College London. ). In other regions, inadequate monitoring of climatic, seismic and volcanic activity may lead to an underestimation of hazard. In Central America, for example, the imbalanced distribution of weather stations, which are concentrated on the Pacific coast, may lead to poor forecasting and monitoring of drought on the Caribbean side of the isthmus (.  Brenes Torres, 2010 Brenes Torres, 2010 Brenes Torres, A. 2010. Elementos y patrones constitutivos del riesgo de sequía en América Central. Background paper prepared for the 2011 Global Assessment Report on Disaster
Risk Reduction. Geneva, Switzerland: UNISDR. Brenes Torres, A. 2010. Elementos y patrones constitutivos del riesgo de sequía en América Central. Background paper prepared for the 2011 Global Assessment Report on Disaster
Risk Reduction. Geneva, Switzerland: UNISDR.Click here to view this GAR paper. Emerging risksEven if these knowledge gaps can be filled, existing assumptions about disaster are being increasingly challenged, as new drivers of risk emerge and interact.Between 1601 and 1603 Russia suffered the worst famine in the country’s history. It is estimated that over 100,000 people starved to death in Moscow alone and perhaps two million in Russia as a whole (Borisenkov and Paseckij, 1988 Borisenkov, E. and Paseckij, V. 1988. Tysjačeletnjaja letopis neobyčajnych javlenij prirody (Millennial annuals of extraordinary natural phenomenon). Moscow, Russia: Myusl. ). It was only recently, however, that climate researchers established a conclusive link between the failure of harvests in Russia in 1601 and the ash cloud produced by the catastrophic explosion of the Huaynaputina Volcano in southern Peru on 19 February 1600 (Thouret et al., 1997. Thouret, J-C, Davila, J., Rivera, M., Gourgaud, A., Eissen, J-P., Le Pennec, J-L. and Juvigné E. 1997. L’éruption explosive de 1600 au Huayaputina (Pérou) la plus volumineuse de l’histoire dans les Andes centrales. Sciences de la Terre et des Planètes / Earth and Planetary Sciences 325: 931–938. ; Briffa et al., 1998. Briffa, K., Jones, P., Schweingruber, F. and Osborn, T. 1998. Influence of volcanic eruptions on northern hemisphere summer temperature over the past 600 years. Nature 393: 450–455. ; de Silva and Zielinski, 1998. de Silva, S.L. and Zielinski., G.A. 1998. Global influence of the AD1600 eruption of Huaynaputina, Peru. Nature 393: 455–458. ; Thouret et al., 2002. Thouret, J-C., Juvigné, E., Gourgaud, A., Boivin, P. and Dávila, J. 2002. Reconstruction of the AD 1600 Huaynaputina eruption based on the correlation of geologic evidence with early Spanish chronicles. Journal of Volcanology and Geothermal Research 115 (3–4): 529–570. ). . Like this example of a disaster caused by an event on the other side of the world, a growing number of potential and plausible risks are either so difficult to identify or have such profound potential consequences, that it is difficult to find an entry point for risk modelling and analysis. Very low-probability hazards, such as geomagnetic storms or volcanic eruptions affecting global weather systems, have always existed. However, there may be no precedent for the emerging risks associated with these hazards as research reveals the increasingly complex vulnerabilities related to the growing interconnection and interdependency of modern societies. As such, there is a growing probability of ‘simultaneous crisis’ where different hazards occur at the same time, ‘sequential crisis’ where hazards trigger cascading disasters in a range of interlocked systems, and ‘synchronous failures’ where different risks converge and interact (Box 1.2). Box 1.2 ‘Synchronous failure’: the earthquake, tsunami and nuclear crisis in Japan, March 2011
On 11 March 2011, a massive earthquake producing intensities of up to XII on the Modified Mercalli
scale occurred 130 km off Japan’s eastern coast causing a tsunami that, together, may have killed
more than 20,000 people. The Great East Japan Earthquake also disrupted critical sections of Japan’s
power grid, including the power supply needed to cool the spent fuel at the Fukushima Daiichi nuclear
power plant. Back-up generators kicked in but were disabled when the tsunami struck the plant, which
was located on the coast. The loss of power to the nuclear plant and the inability to cool the spent
fuel appear to have led to partial meltdowns of at least three of the plant’s reactors, causing the worst
nuclear disaster since that at Chernobyl in 1986. The earthquake, its aftershocks, the tsunami and the nuclear emergency illustrate what a ‘synchronous failure’ looks like: a multi-sectoral system’s collapse. The full consequence of the trauma and costs will not be known for years to come. However, in the immediate aftermath of the disaster, it became evident that even in this highly sophisticated and well-prepared society, the impact of physical hazards on infrastructure can quickly lead to outcomes normally associated with poorer countries: large-scale food and water shortages, shelter crises and logistical collapse. (Source: Kent, 2011) On 26 July 2005, the eighth heaviest 24-hour rainfall ever recorded fell on Mumbai, and the resulting flood offers a glimpse into what a ‘synchronous failure’ looks like. Overwhelmed sewage systems, damaged physical infrastructure, and disrupted communications systems greatly intensified the flood’s impact. Throughout the city, ATM networks collapsed, the Bombay and National Stock Exchanges became largely inoperative, the Mumbai-Pune Expressway was closed and the Chatrapati Shivaji International Airport was shut down ( Kent, 2010a Kent, R. 2010a. Disaster risk reduction and changing dimensions and dynamics of future crisis drivers. Background Paper to the Global Assessment Report 2011. Geneva, Switzerland: UNISDR.Click here to view this GAR paper. In 2010, western Russia experienced a ‘sequential crisis’ as a heat-wave created conditions for wildfires, exposing layers of new and emerging vulnerabilities that cascaded into impacts in areas as diverse as health and air traffic for which there was no historical precedent (Box.1.3). Box 1.3 Heat wave and wildfires in western Russia and Ukraine in 2010
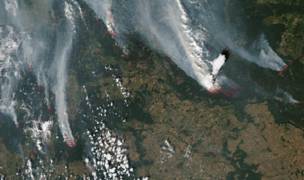
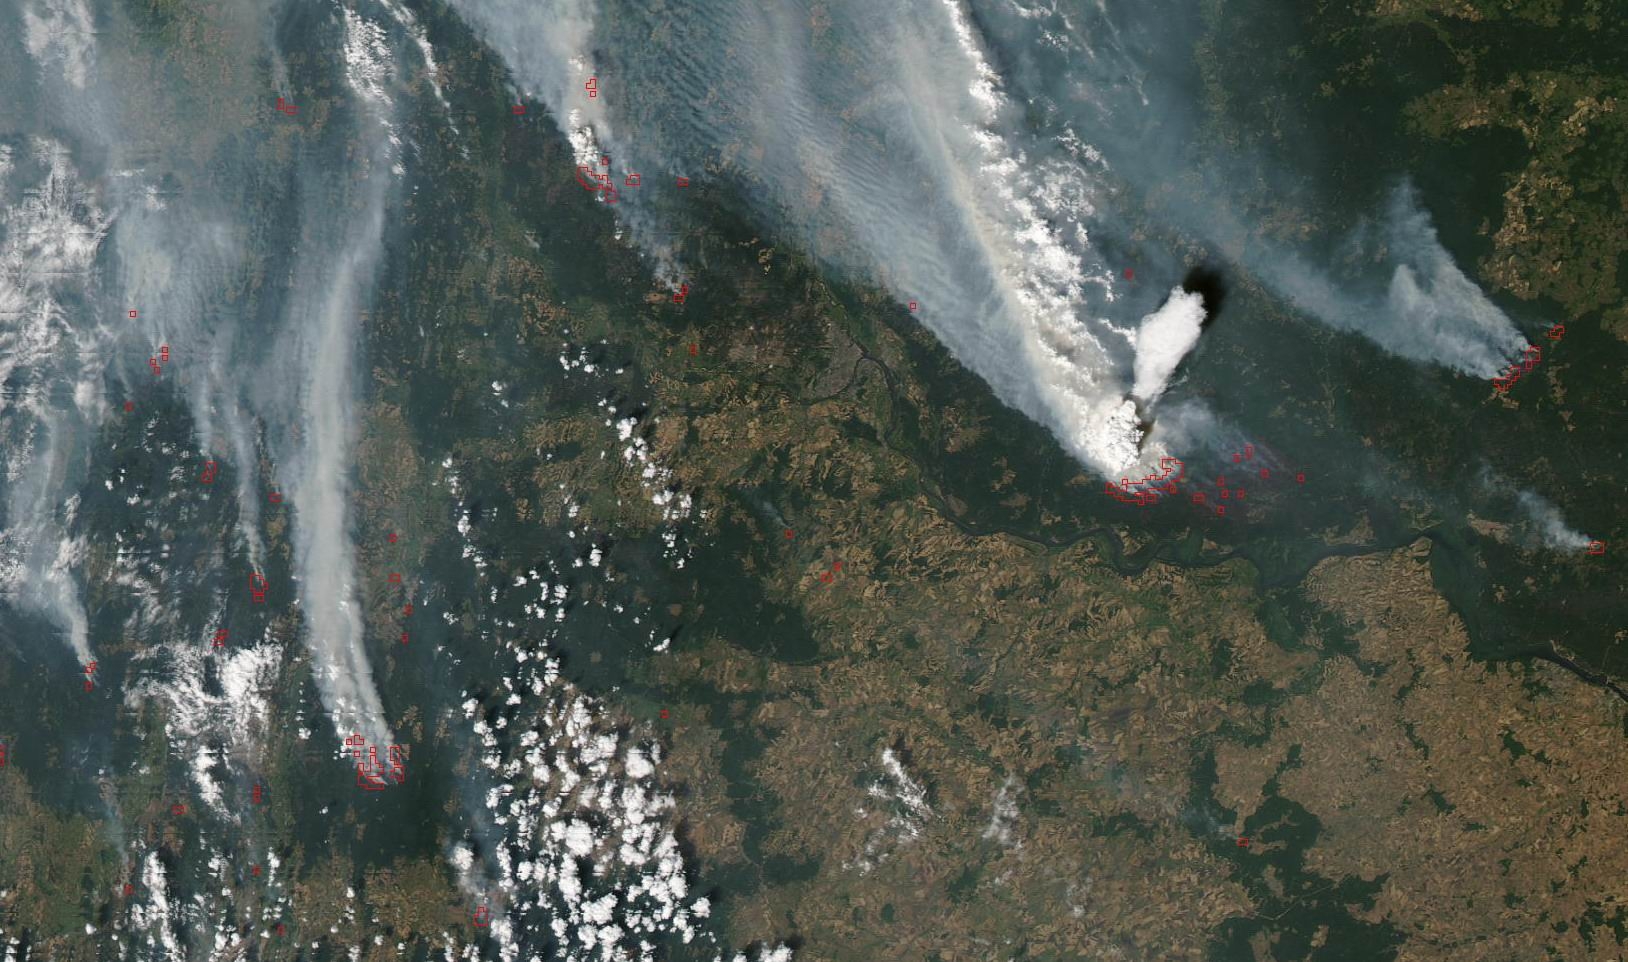
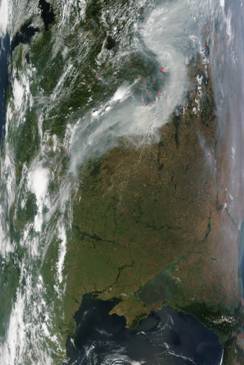
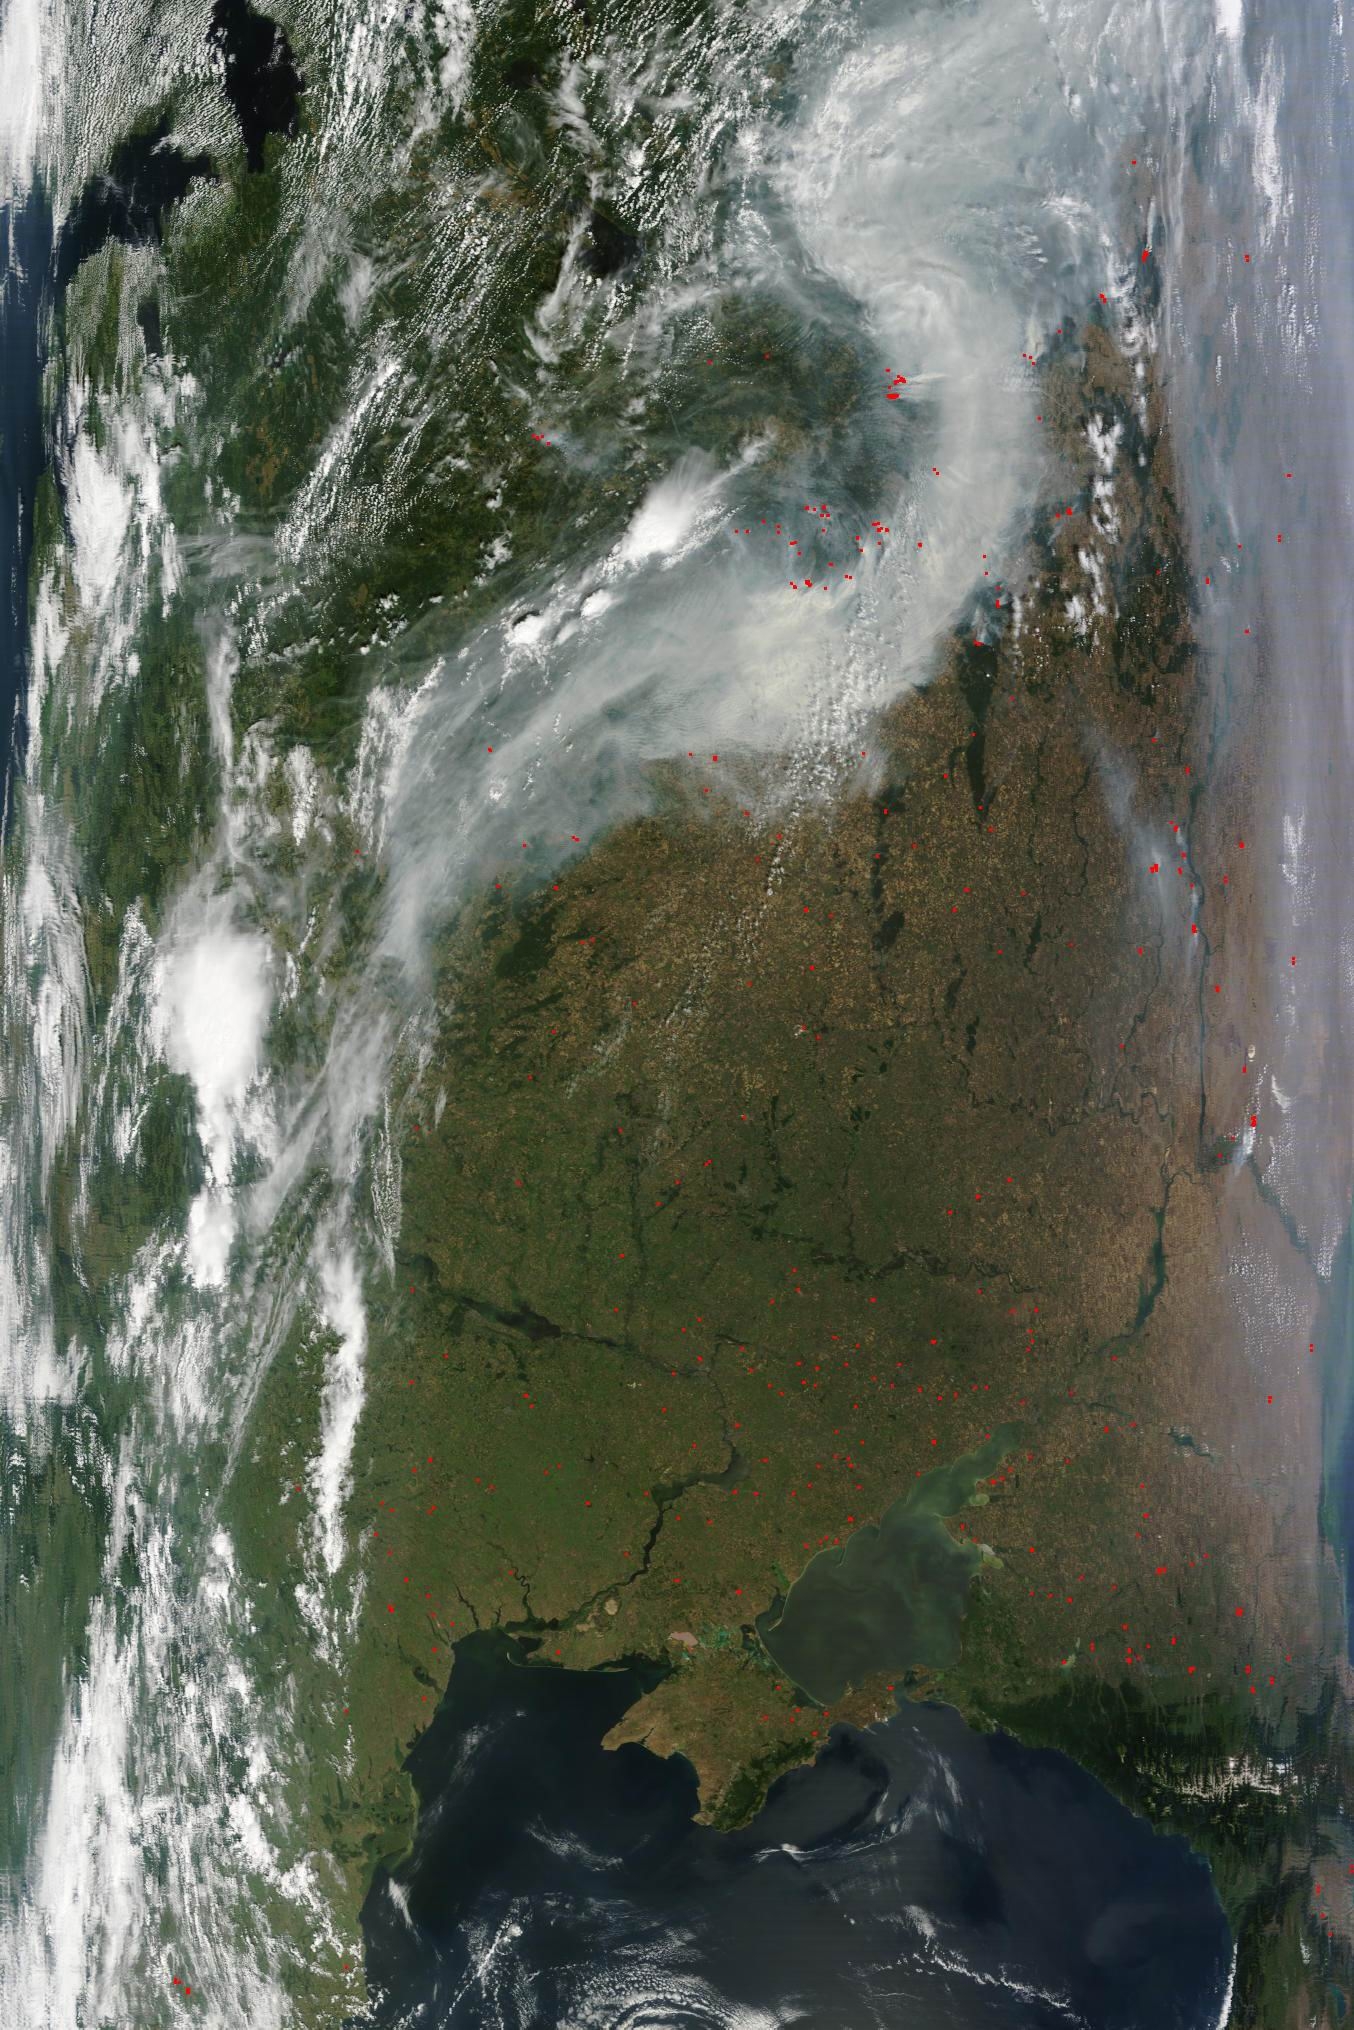
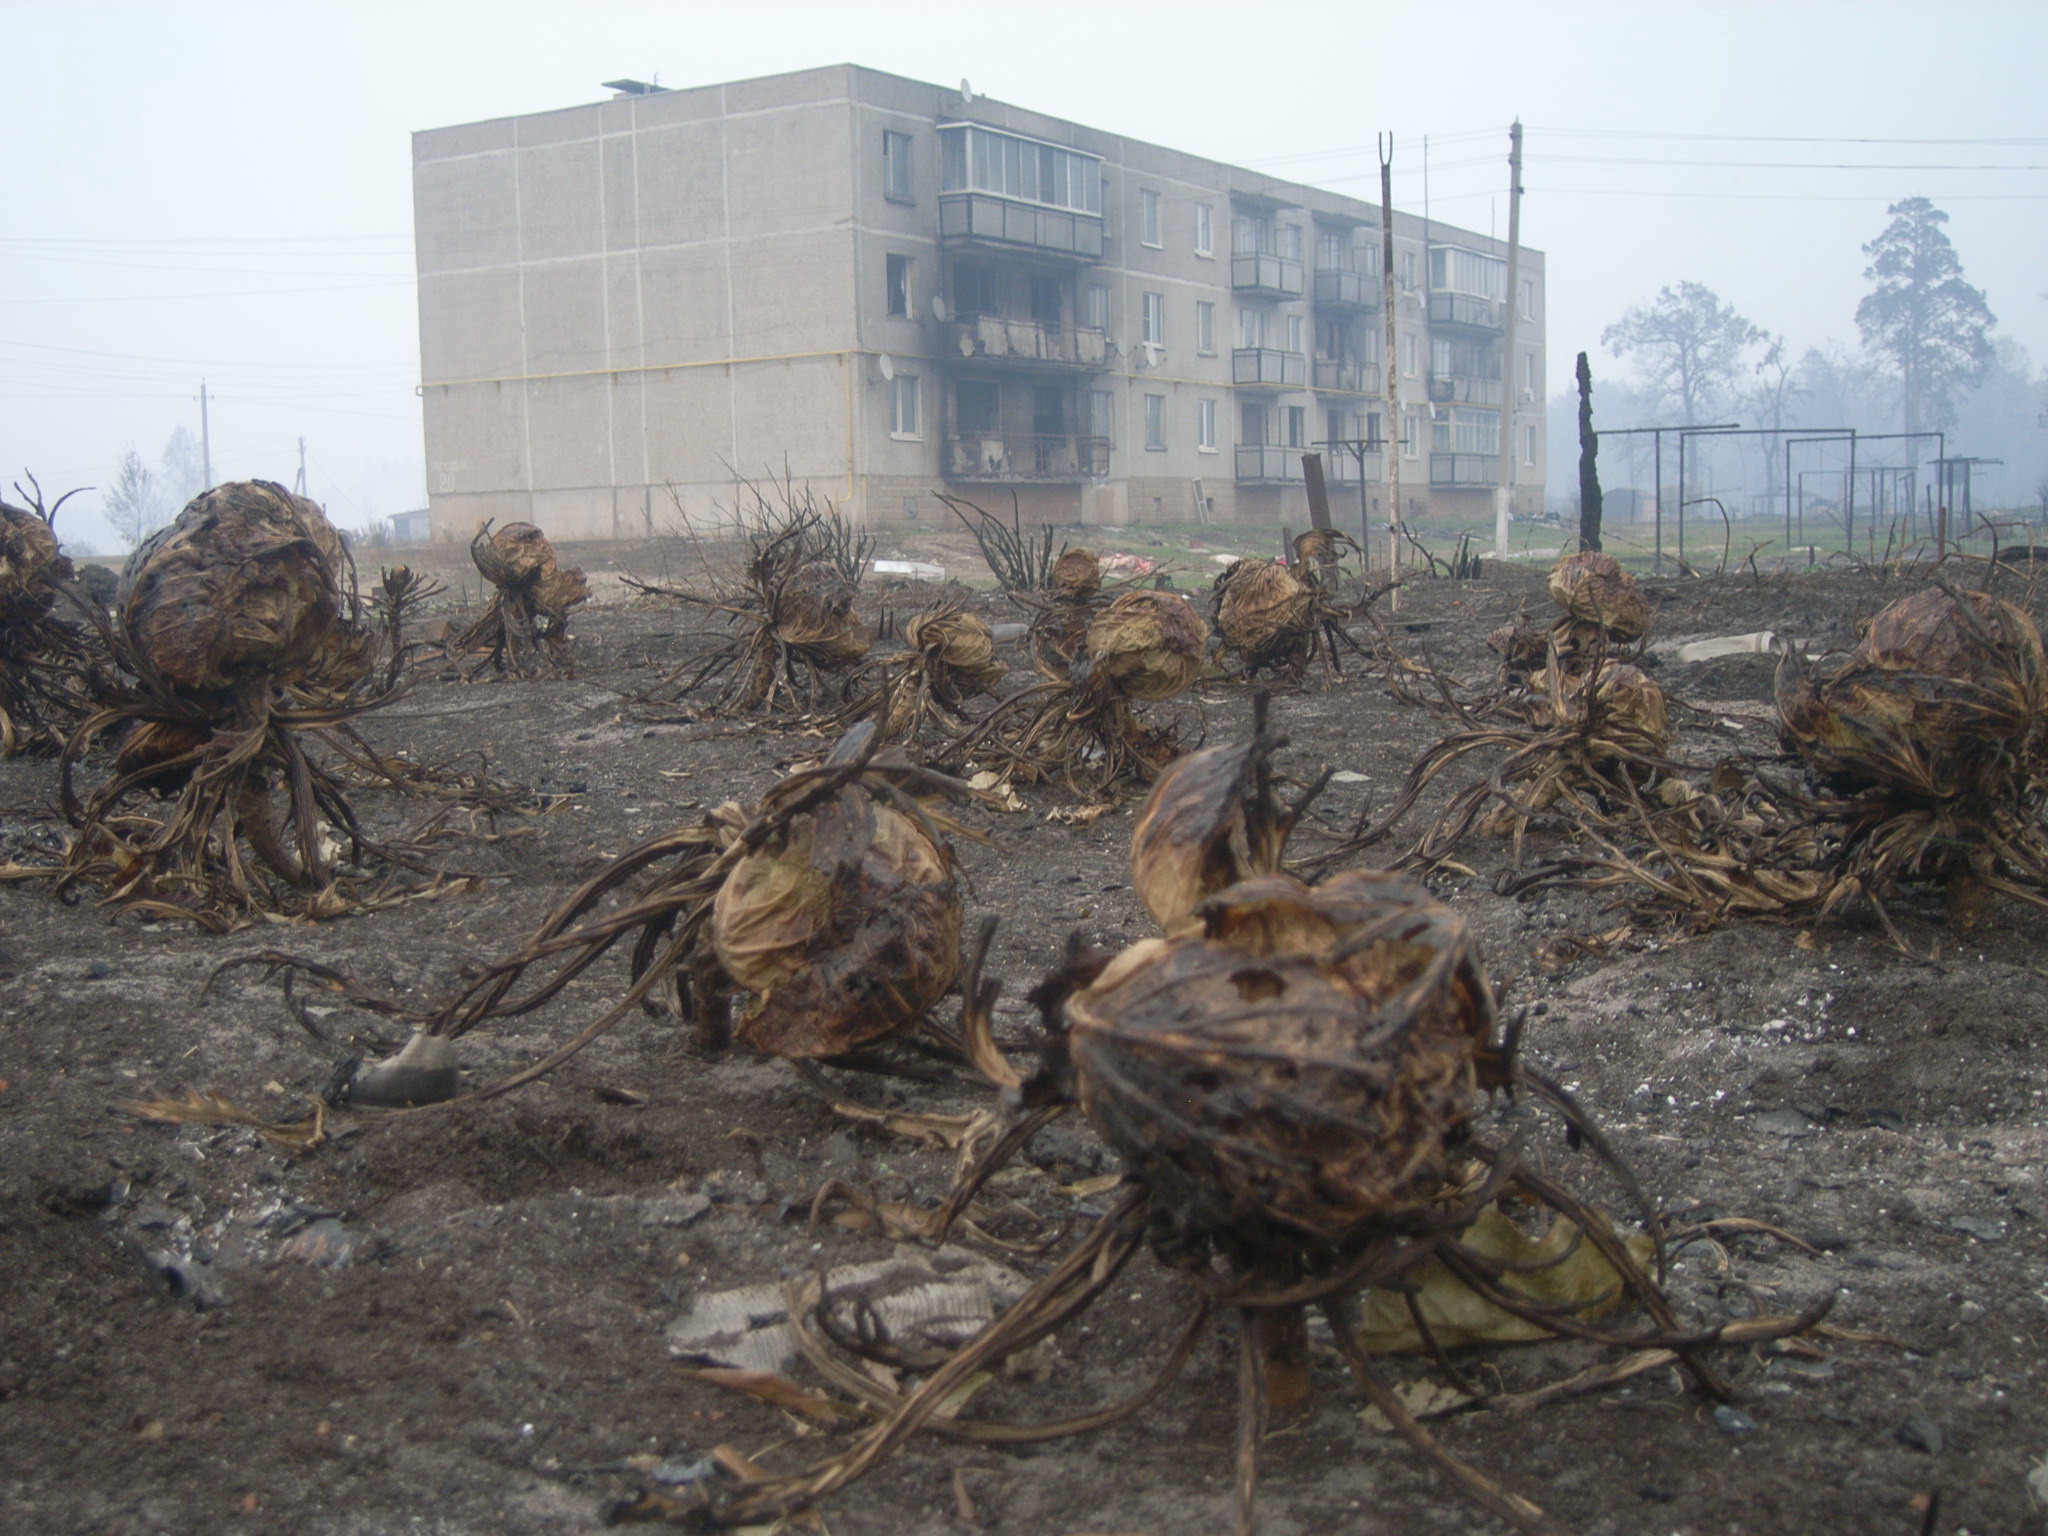
In 2010, western Russia experienced the hottest summer since the beginning of systematic weather data recording 130 years ago. Lack of rainfall in early 2010 and July temperatures almost 8°C above the long-term average, led to parched fields, forests and peat lands that posed a high wildfire risk. Analysis of satellite data reveals that most fires started in agricultural areas and around villages, but dry lightning storms also caused some severe forest and peat-land fires.
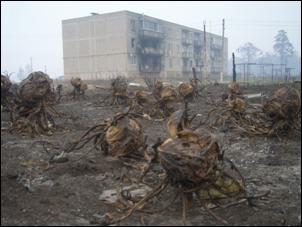
One of the most significant effects of the fires, which affected around 800,000 hectares in western Russia between July and September 2010, was the persistent near-ground air pollution. Moscow and its surroundings, with more than 15 million inhabitants, were covered by smoke for many weeks. People with cardiovascular and respiratory diseases, the elderly and the very young were particularly affected. During and after the wildfires, Russia’s mortality rate increased by 18 percent. In August alone, 41,300 more people died as compared to August 2009, due to both the extreme heat and smoke pollution. The direct losses from fires in western Russia included the deaths of more than 50 civilians and firefighters, some 2,000 houses burnt down including more than 30 villages completely destroyed, large areas of crop land ruined, and more than 60,000 flights cancelled or delayed. The medium- to long-term effects of smoke pollution on morbidity and premature mortality, however, have not yet been calculated. Social and economic change has greatly increased the risk posed by wildfires in rural western Russia. Traditional agricultural and pastoral livelihoods have declined, accompanied by the migration of young people to cities. Many villages are now primarily weekend or summer retreats, reducing responsibility for the careful and sustainable management of surrounding forests. National responsibility for forestry in the former Soviet Union had been highly centralized with strong control and management. The subsequent decentralization of these responsibilities and the exploitation of forests by the private sector may have also contributed to declining standards of forest management and protection, increasing wildfire risks. Figure 1.3 Impact of forest and wildfires in Russia and Ukraine, 2010 (satellite images: MODIS sensor on NASA’s Terra and Aqua satellites)
(Source and images: GFMC, 2010 GFMC (Global Fire Monitoring Centre). 2010. The western Russian wildfires of 2010. Background paper prepared for the 2011 Global Assessment Report on Disaster
Risk Reduction. Geneva, Switzerland: UNISDR.Click here to view this GAR paper. |

 |
x | |
 |
Corrales Leal, W. 2010. Overcoming trade and development limitations associated to climate change and disaster risk. . [View] GFMC (Global Fire Monitoring Centre). 2010. The western Russian wildfires of 2010. Background paper prepared for the 2011 Global Assessment Report on Disaster Risk Reduction. Geneva, Switzerland: UNISDR.[View] Kent, R. 2010a. Disaster risk reduction and changing dimensions and dynamics of future crisis drivers. [View] Moreno, A. and Cardona, O.D. 2011. Efectos de los desastres naturales sobre el crecimiento, el desempleo, la inflación y la distribución del ingreso: Una evaluación de los casos de Colombia y México [View] Seballos, F. and Tanner, T. 2011. Child-centred disaster risk reduction [View] |
|
 |
||
| |

 GAR 2011 Contributing Papers