Global Assessment Report on Disaster Risk Reduction 2013
From Shared Risk to Shared Value: the Business Case for Disaster Risk Reduction |
Global Assessment Report on Disaster Risk Reduction 2013
From Shared Risk to Shared Value: the Business Case for Disaster Risk Reduction |
|
|


|
27
(Source: UNISDR)
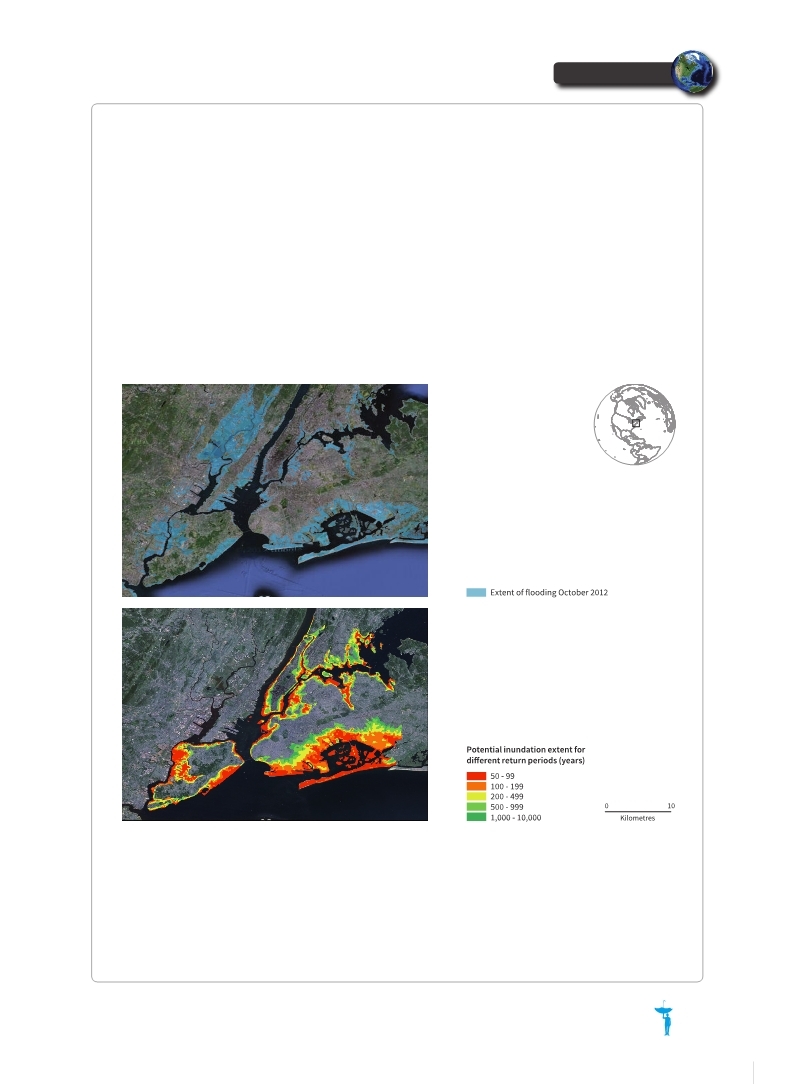
(Source: Swiss Re Hurricane Storm Surge Model)
Box 1.2 ‘Super-storm’ Sandy viii
In October 2012, sub-tropical storm Sandy triggered the evacuation of thousands from the East Coast of the United States of America, leading to the shut-down of national and local transport systems and severely disrupted electricity and communication supplies, with power cuts affecting an estimated 8.5 million homes and businesses (RMS, 2012
RMS (Risk Management Solutions,Inc.). 2012.,Too Early to Calculate Reliable Loss Estimates for Hurricane Sandy., Risk Management Solutions, 21 November 2012., London,UK.. . Time. 2012.,Hurricane Sandy Estimated to Cost $60 Billion., Time Magazine, Business & Money, 31 October 2012.. . IHS Global Insight. 2012.,As the clear-up begins, a look at hurricane Sandy’s likely economic toll., Country & Industry Forecasting, 31 October 2012.. . Soon after the storm passed, it was clear that indirect losses to business activity caused by disruption to public transport and energy supplies were likely to be greater than direct losses (EqCat, 2012; IHS Global Insight, 2012
IHS Global Insight. 2012.,As the clear-up begins, a look at hurricane Sandy’s likely economic toll., Country & Industry Forecasting, 31 October 2012.. . Figure 1.3 Extent of flooding in New York City due to Super-storm Sandy (top) compared with a hazard map showing areas that could be expected to be flooded due to storm surges (bottom)
Super-stormSandy
|


 |