Global Assessment Report on Disaster Risk Reduction 2013
From Shared Risk to Shared Value: the Business Case for Disaster Risk Reduction |
Global Assessment Report on Disaster Risk Reduction 2013
From Shared Risk to Shared Value: the Business Case for Disaster Risk Reduction |
|
|


|
53
(Source: UNISDR)
terruption, risks to agriculture, forestry or other rural sectors nor mortality and injury.
By quantifying the value of urban produced capital exposed to each potential hazard event that could occur in each location, and by assessing its likely vulnerability, it is then possible to estimate the probability of how much disaster loss could occur in a given time period.
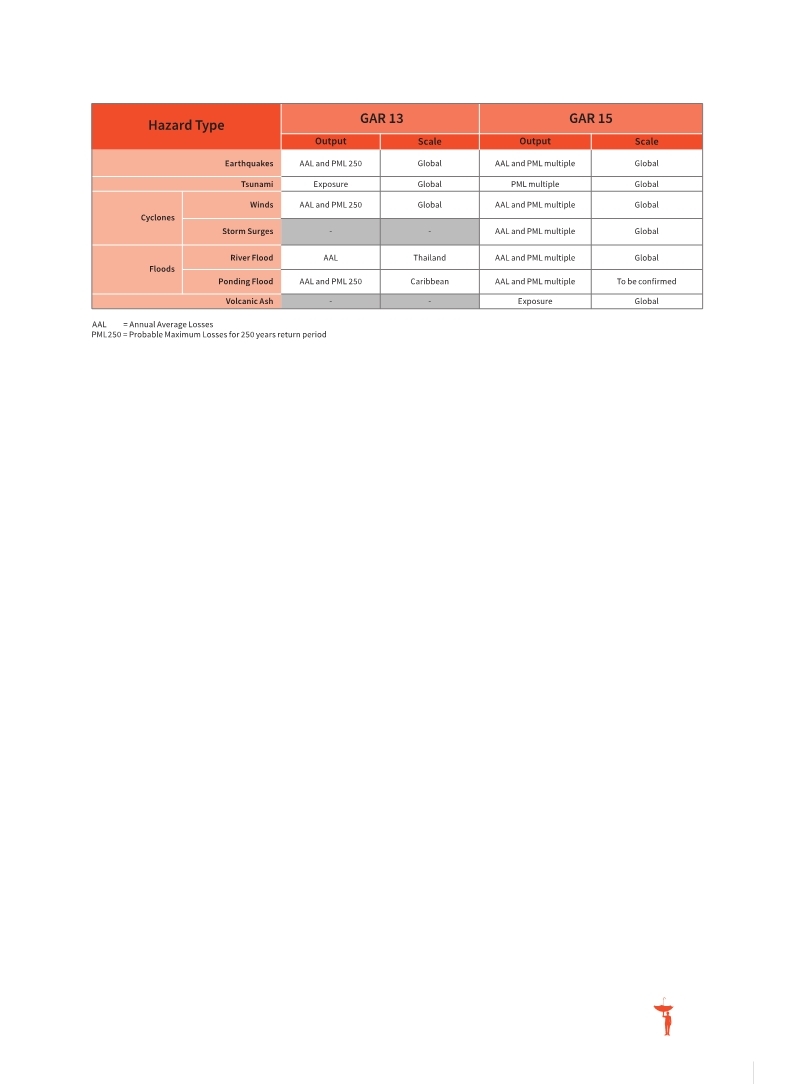
Maximum losses associated with events of specific return periods are described as probable maximum losses (PML): for example, the maximum loss that might occur once every 250 years would reflect a 0.4 percent probability of the loss occurring in any given year. When PML for all events that could occur are averaged over a long period, then annual average loss (AAL) can be calculated.
Depending on the hazard profile of a country, the AAL represents the probability of both frequently occurring losses, for example, with return periods of five or ten years, as well as highly infrequent losses that may occur, for example, once every thousand years. For that reason, AAL should not be confused with the average observed losses that have occurred, even if records go back a century or more. A country may have a relatively high AAL—from earthquakes, for example—if catastrophic loss is expected from a rare thousand-year event, even though
there may be no recorded earthquake loss over the last 100 years.
Annex 1 provides a technical description of how the new GAR global risk model is being developed.
Risk estimates are computed using highly simplified global hazard models, a proxy for the exposure of urban produced capital and a standardised global set of vulnerability curves. Owing to the simplification inherent to global modelling and to the limitations of the current input data on hazard, exposure and vulnerability, the estimates obtained from the model have an intrinsic degree of error and uncertainty. As such, estimates are presented as a set of risk classes rather than as absolute numbers and represent the likely order of magnitude of loss.
Given that the estimates are calculated using the same methodology and with consistent global level proxy data, risk classes are internally coherent at the global level and provide a point of comparison between risk levels in countries and territories. These risk classes should be considered as starting points to understand the degree of possible annual losses for a country, enabling a government to discuss which disaster risk management strategies are most appropriate for its risk profile. The risk classes may also help investors to understand the degree of risk faced by different countries.
Figure 3.1 GAR Global Risk Model deliverables for 2013 and 2015
|


 |