 |
Global Assessment Report on Disaster Risk Reduction 2013
From Shared Risk to Shared Value: the Business Case for Disaster Risk Reduction |
|
Global Assessment Report on Disaster Risk Reduction 2013
From Shared Risk to Shared Value: the Business Case for Disaster Risk Reduction |
|
|


|
219
high-income countries to reduce expenditure on public infrastructure while assuring and improving service levels. The first step is to create inventories of public assets, which can then be used for tracking investments in disaster risk reduction. This can align the interests of finance ministries with disaster risk reduction objectives. Inventories can then be used for risk assessment or to develop risk financing solutions. For example, the Mexican Government has an inventory database of buildings, roads and other public assets and data are used for estimating exposure to design risk transfer strategies (G20/OECD, 2012
G20/OECD. 2012.,Disaster Risk Assessment and Risk Financing. A G20/OECD Methodological Framework., Paris,France: OECD.. Available at http://www.oecd.org/gov/risk/G20disasterriskmanagement.pdf.. In countries where public infrastructure and services have been privatised, the adoption of an asset management approach to disaster risk reduction investment tracking is challenging. However, in the United States of America, the national asset data-
base maintained by the Department of Homeland Security (DHS), which contains information on more than 77, 000 assets—including national critical infrastructures, including dams and nuclear power plants (Moteff, 2007
Moteff, J. 2007.,Critical Infrastructure: The National Asset Database., CRS Report for Congress. Updated July 16, 2007., Congressional Research Service.,. Available at http://www.fas.org/sgp/crs/homesec/RL33648.pdf. Widely varying interpretations of terminology also make inter-country comparison difficult (
 Gordon, 2013 Gordon, 2013 Gordon, M. 2013.,Exploring Existing Methodologies for Allocating and Tracking Disaster Risk Reduction in National Public Investment., Background Paper prepared for the 2013 Global ASsessment Report on Disaster Risk Reduction., Geneva,Switzerland:UNISDR.. Gordon, M. 2013.,Exploring Existing Methodologies for Allocating and Tracking Disaster Risk Reduction in National Public Investment., Background Paper prepared for the 2013 Global ASsessment Report on Disaster Risk Reduction., Geneva,Switzerland:UNISDR.. Click here to view this GAR paper. Despite these difficulties and the consistent message by countries regarding the limited resources available over the long term to make the required investments, there is anecdotal evidence, both from reviews of budget allocations as well as from the HFA Monitor, which highlights that overall expendi-
Box 14.6 Tracking investment in disaster risk reduction
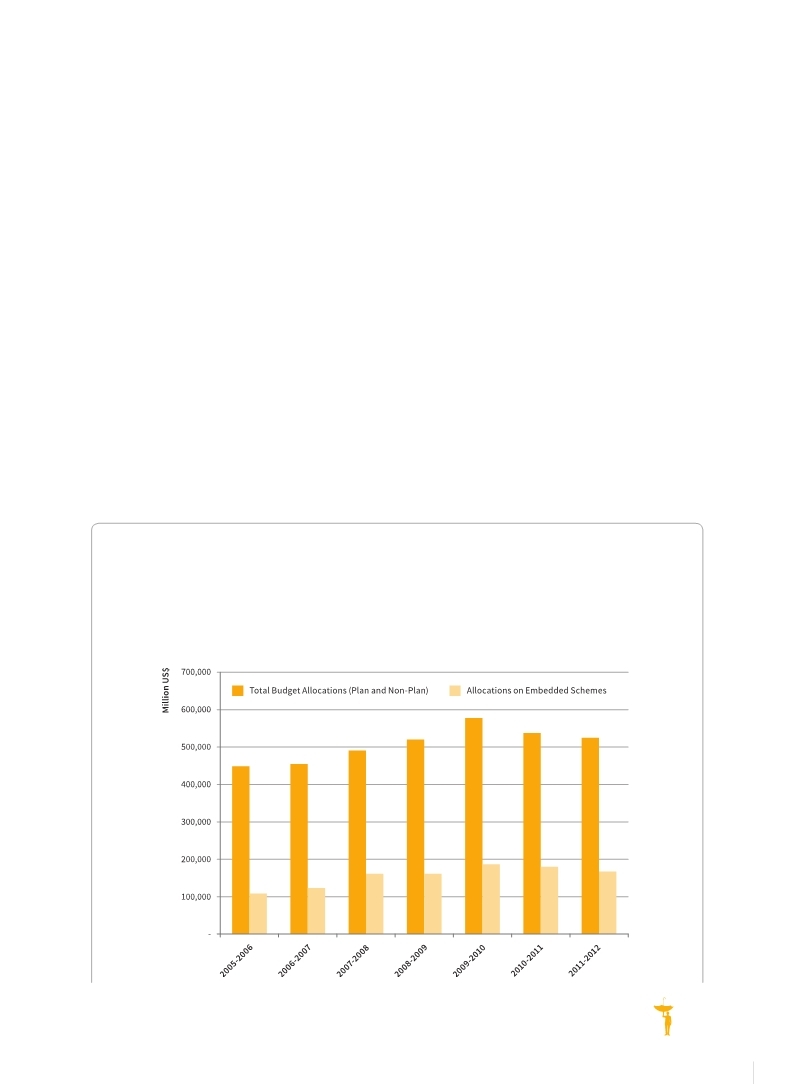
In India, although the allocation to Dedicated Schemes on Disaster Management remained stable from 2005– 2006 to 2011–2012 (from US$5.09 billion in 2005–2006 to US$4.96 billion in 2011–2012), embedded disaster risk reduction investments has grown both in absolute terms and as a percentage of total budget (Dhar Chakrabarti, 2012
Dhar Chakrabarti, P.G. 2012.,Understanding existing methodologies for allocating and tracking DRR resources in India., Study commissioned by UNISDR., Bangkok,Thailand. . (Source: Dhar Chakrabarti, 2012
Dhar Chakrabarti, P.G. 2012.,Understanding existing methodologies for allocating and tracking DRR resources in India., Study commissioned by UNISDR., Bangkok,Thailand. . Figure 14.6 Total budget allocation and allocations on embedded schemes in India
|


 |