 |
Global Assessment Report on Disaster Risk Reduction 2013
From Shared Risk to Shared Value: the Business Case for Disaster Risk Reduction |
|
Global Assessment Report on Disaster Risk Reduction 2013
From Shared Risk to Shared Value: the Business Case for Disaster Risk Reduction |
|
|


|
158 Part II - Chapter 10
crops, livestock and fisheries products often still presume “normal weather conditions” as part of “a plausible view on the evolution of the global agricultural markets over the next decade” (OECD and FAO, 2012), and continue to discount for disaster risk in growth projections.
Increasing global demand for biofuels, triggered by higher oil prices, has significantly underpinned price hikes (Matondi et al., 2012; Fava Neves, 2011
Fava Neves, M. 2011.,Food chains and the reasons behind rising food prices., Food Chain, Vol. 1, No. 1. (May 2011). pp. 52-70.. . The production of major food crops is concentrated in selected countries that are exposed to frequent hazards. For example, as Figure 10.8 shows, in 2011, the United States of America grew 28 percent of the world’s coarse grain and 8 percent of wheat, whereas China produced 17 percent of wheat and coarse grain and 29 percent of rice. Another hazard-prone country—India—also produced 21 percent of rice, 12 percent of wheat and 4 percent of coarse grain. Rice production especially is heavily concentrated in hazard-prone regions, with more than 70 percent of production concentrated in five hazard-prone Asian countries (OECD and FAO, 2012).
Higher costs of inputs, such as fertilisers owing to high oil prices, and growing constraints from water and land degradation, tend to slow yield and productivity growth, lessening the pace of production and contributing to lower stocks (OECD and FAO, 2012). For example, growth in yield rates for major cereals in low-income countries has been declining consistently since the 1980s, as shown in Figure 10.9.
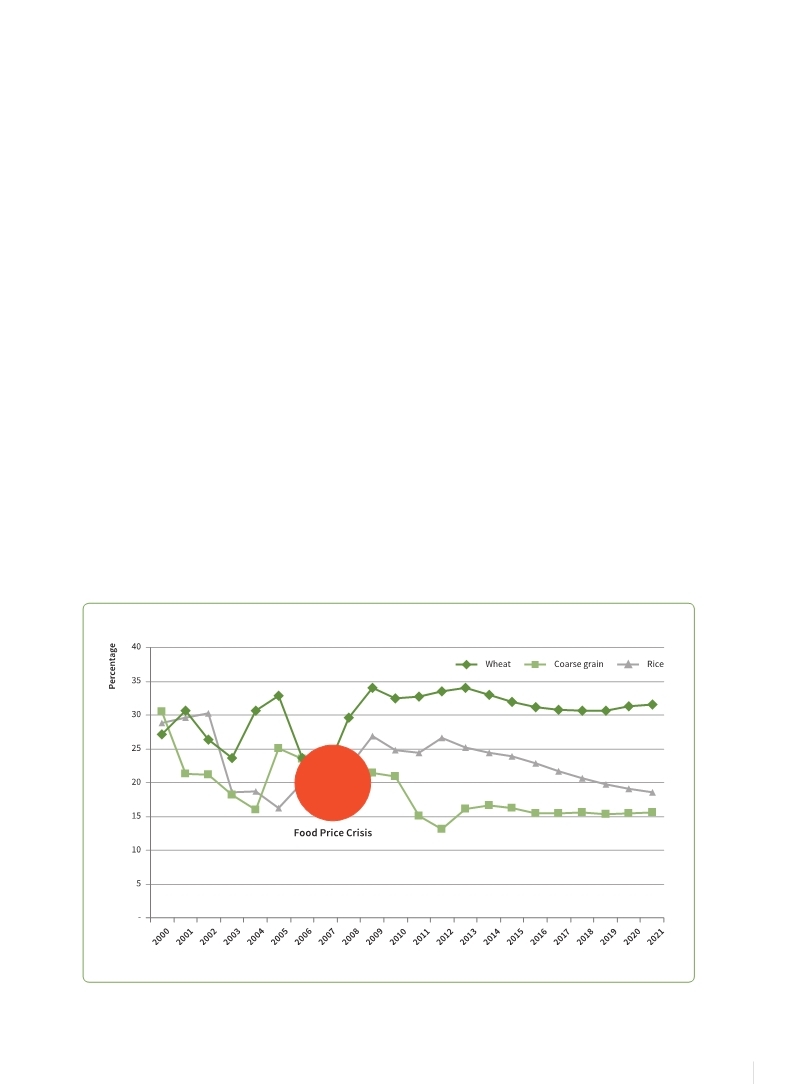
Figure 10.10 Global stock in relation to domestic demand for wheat, coarse grain and rice, 2001–2021
|


 |