Global Assessment Report on Disaster Risk Reduction 2013
From Shared Risk to Shared Value: the Business Case for Disaster Risk Reduction |
Global Assessment Report on Disaster Risk Reduction 2013
From Shared Risk to Shared Value: the Business Case for Disaster Risk Reduction |
|
|


|
108 Part I - Chapter 7
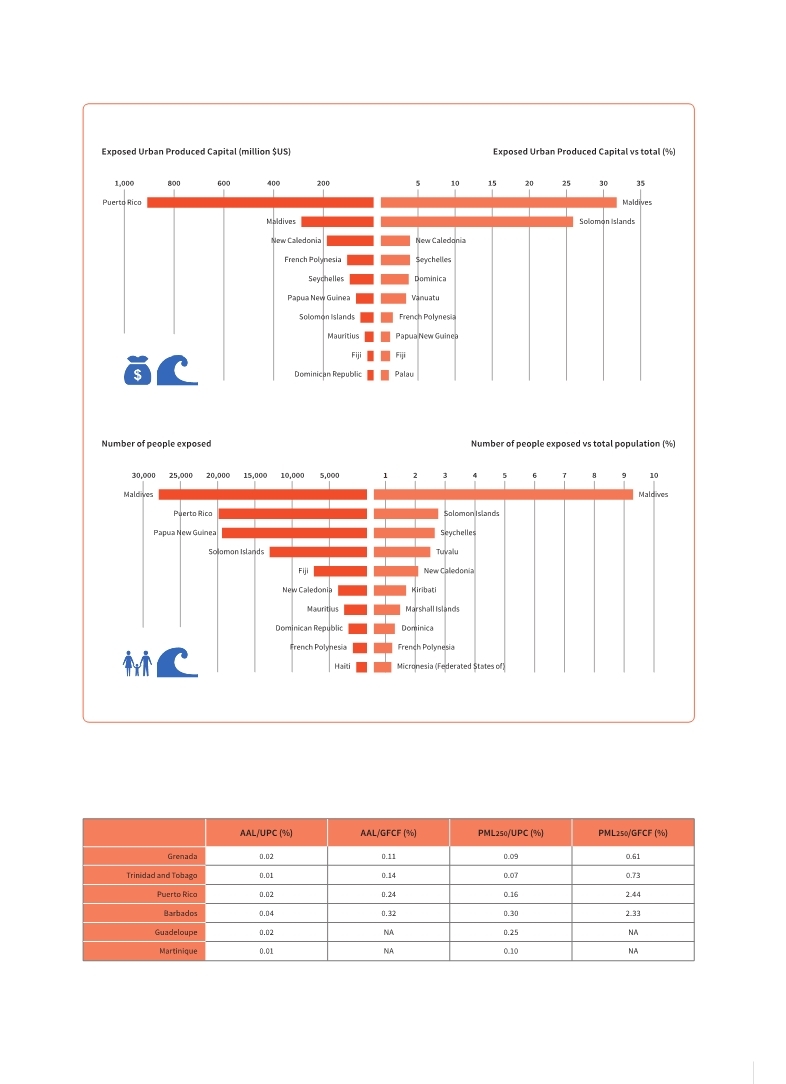
Figure 7.3 Absolute and relative urban produced capital (top) and population (bottom) exposed to tsunamis in SIDSiii
(Source: UNISDR, based on GAR global risk model)
Table 7.1 Annual average losses and probable maximum losses (250 years return period) from ponding flooding for selected Caribbean countries
(Source: GAR global risk model)
|


 |