

 |
Global Assessment Report on Disaster Risk Reduction 2011
Revealing Risk, Redefining Development |
  |
2.3.1 Weather-related disaster damage is increasing exponentiallyAcross the 21 countries and states (see Box 2.4), disaster occurrence and loss was down significantly in 2009. Given that most extensive risk is weather-related, its manifestations are closely related to climate variability, associated for example with the El Niño Southern Oscillation. As such it can be expected that both the number of events and losses increased again in 2010. Looking at the longer-term picture, the past 20 years have seen a significant increase in the number of local areas reporting losses, the number of houses damaged, the number of people affected and the damage to health and educational facilities associated with extensive disasters (Figure 2.24). This reinforces the view that the rapid increases in both population and GDP exposure described in Section 2.2 have not been addressed by commensurate reductions in vulnerability.Figure 2.24
Extensive risk trends by indicator (for the 21 countries and states included in the GAR11 analysis) 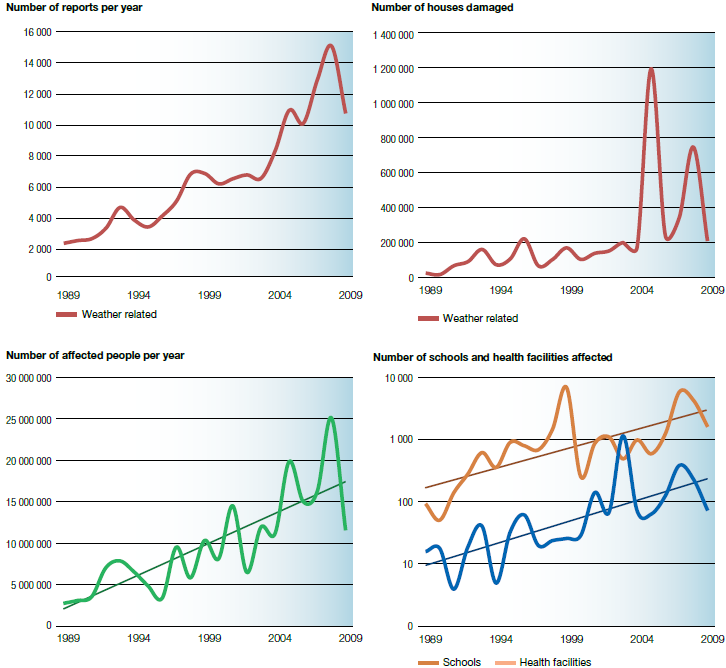 Extensive risk is also rising in relative terms.
The number of houses damaged relative to
population growth in all 21 countries and states
has increased by approximately 600 percent
since the early 1990s (Figure 2.25). The
enormous difference between this increase
and the increasing economic loss to major
hazards, described in Section 2.2, reflects how
extensive disaster loss is largely unaccounted for,
disguising a transfer of risk within countries to
low-income households and communities.
Extensive risk is also rising in relative terms.
The number of houses damaged relative to
population growth in all 21 countries and states
has increased by approximately 600 percent
since the early 1990s (Figure 2.25). The
enormous difference between this increase
and the increasing economic loss to major
hazards, described in Section 2.2, reflects how
extensive disaster loss is largely unaccounted for,
disguising a transfer of risk within countries to
low-income households and communities.Figure 2.25
Number of houses damaged per million people per year (using all 21 datasets) Figure 2.26 (right) Number of local administrative areas annually reporting extensive disaster losses 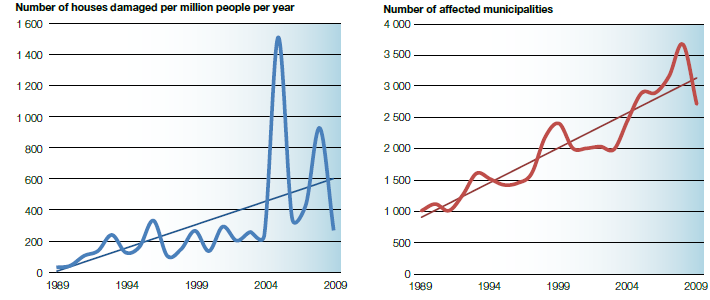
2.3.2 Extensive risk is expanding geographicallySpatially, the expansion of extensive risk mirrors urban and regional development and hence increasing population and asset exposure. Across all 21 countries and states, the number of local administrative areas reporting disaster losses has increased more or less continuously over the past 20 years (Figure 2.26). In Mozambique, for example, more local administrative areas reported losses more often between 1999 and 2009, than between 1989 and 1999 (Figure 2.27).Figure 2.27
Spatial extent of extensive risk in Mozambique: number of reports per district, 1989–1999 and 1999–2009 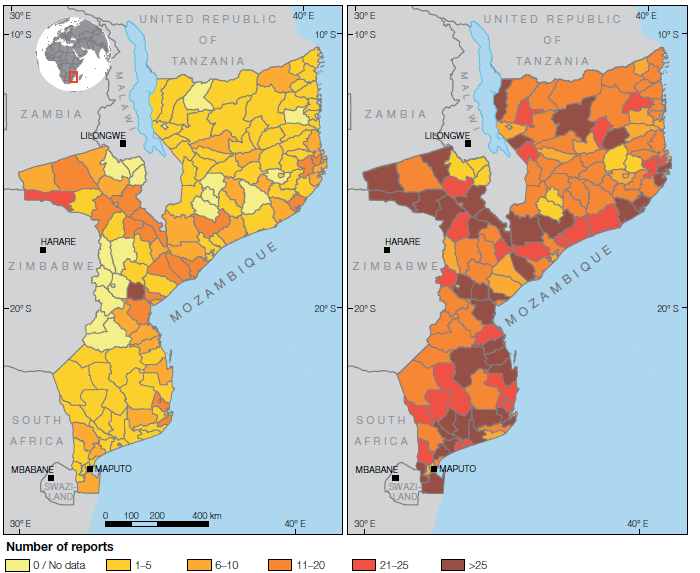
2.3.3 Mortality is still rising in the countries with the weakest risk governance capacitiesThese global trends in risk vary widely from country to country, indicating that risk accumulation processes that mirror development are as heterogeneous as development itself. However, confirming again the findings of Section 2.2, countries with stronger risk governance capacities appear better able to reduce mortality than to reduce the numbers of houses damaged and people affected (Table 2.7). The increase in extensive mortality risk reported in countries like Bolivia, Mozambique, Nepal and Yemen reflect low levels of development. In contrast, mortality risk in Chile and Costa Rica is falling while the rate of housing damage is rising. The heterogeneous nature of risk is further illustrated in Box 2.6, which explains that even in the world’s largest economy, the United States of America, there are major differences in risk governance capacities among wealthier and poorer states and counties.Table 2.7 Extensive risk trends: houses damaged, people affected and mortality 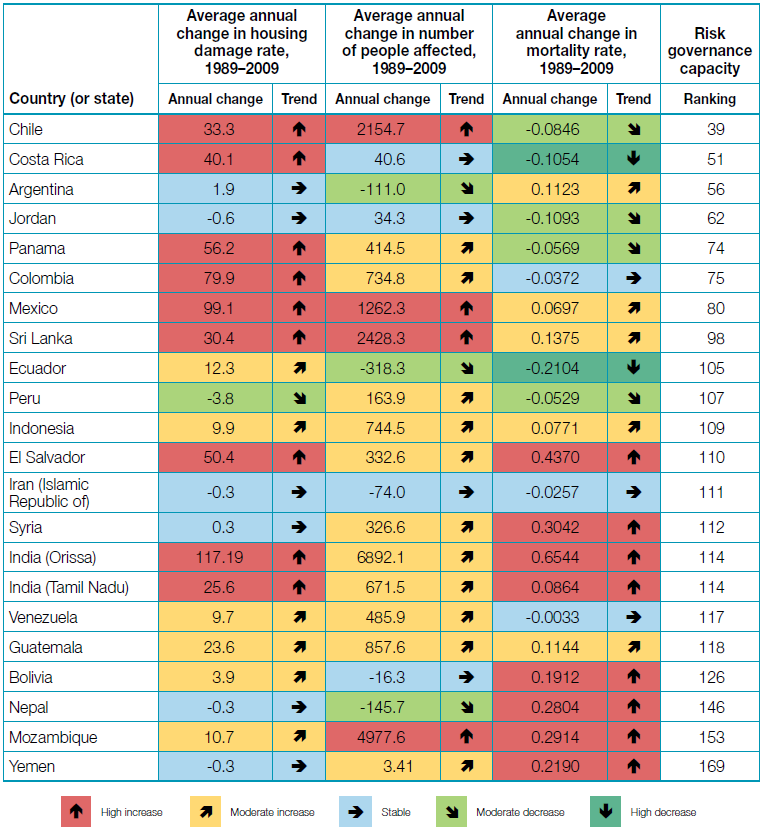 2.3.4 Revisiting the underlying risk driversImproved reporting of disaster impacts and losses makes it difficult to determine with precision the cause of any increase in reports of disaster impacts and losses over time, even in the last 20 years. In the case of national disaster databases, there is certainly evidence of improved reporting in some countries such as Costa Rica and Sri Lanka, where new official data sources began to contribute to the datasets during the GAR11 analysis period. Nevertheless, improved reporting alone does not appear to explain the increase in damaged housing, for example, across the 21 countries and states used in the GAR11 analysis.New case study evidence supports GAR09’s finding that increasing extensive risk is closely related to the challenges low- and middleincome countries face in addressing underlying risk drivers and reducing vulnerability. Risk is increasing most rapidly in small- and medium-sized urban centres with relatively weak capacities for managing urban growth (Table 2.8). Compounding this, landslide and flood risk at the local level is closely associated with poverty, and overall risk is magnified by deforestation and the destruction of coastal ecosystems. Table 2.8 Risk drivers and disaster outcomes
2.4 Impacts on children and internal displacement
Children make up a large proportion of those who are most vulnerable to disasters, and they are affected particularly severely when they occur. Disasters can also contribute heavily to internal displacement, even when mortality is relatively low. The mechanisms through which disaster losses contribute to poverty were explored in depth in GAR09 (UNISDR, 2009  UNISDR (United Nations International Strategy for Disaster Reduction). 2009. Global assessment report on disaster risk reduction: Risk and poverty in a changing climate. Geneva, Switzerland: United Nations International Strategy for Disaster Reduction. UNISDR (United Nations International Strategy for Disaster Reduction). 2009. Global assessment report on disaster risk reduction: Risk and poverty in a changing climate. Geneva, Switzerland: United Nations International Strategy for Disaster Reduction.Click here to go to GAR09 page. Children are affected particularly severely by disasters and constitute an extremely large percentage of those who are most vulnerable (Bartlett, 2008 Bartlett, S. 2008. The implications of climate change for children in lower-income countries. Children, Youth and Environments 18 (1): 71–98. ). This is supported by a number of studies on how disasters affect children’s medium-term development
(Baez and Santos, 2007. Baez, E. and Santos, I. 2007. Children's vulnerability to weather shocks: A natural disaster as a natural experiment. Washington DC, USA: The World Bank. ; López-Calva and Ortiz-Juárez, 2009. López-Calva, L.P. and Ortiz-Juárez, E. 2009. Evidence and policy lessons on the links between disaster risk and poverty in Latin America: Methodology and summary of country studies. New York, USA: UNDP. ; Rodriguez-Oreggia et al., 2010. Rodriguez-Oreggia, E., Fuente, A. de la, Torre, R. de la, Moreno, H. and Rodriguez, C. 2010. Impact of natural disasters on human development and poverty at the municipal level in Mexico. CID Working Paper No. 43. Cambridge, MA, USA: Harvard University Center for International Development. ). For example, destroyed or damaged schools together with the loss of household assets and livelihoods can force children out of school, and infant malnutrition caused by loss of food supplies may cause stunting and lead to poor educational achievement and greater propensity to disease.. Recent studies conducted in Bolivia, Indonesia, Mexico, Mozambique, Nepal, the Philippines and Viet Nam provide evidence of how extensive disasters negatively affect children’s education, health and access to services such as water and sanitation, though it was difficult to establish significant relationships between intensive disasters and child welfare (  Tarazona and Gallegos, 2010 Tarazona and Gallegos, 2010 Tarazona, M. and Gallegos, J. Children and disasters: Understanding differentiated risk and enabling child-centered agency. Brighton, UK: Children in a Changing Climate Research. Tarazona, M. and Gallegos, J. Children and disasters: Understanding differentiated risk and enabling child-centered agency. Brighton, UK: Children in a Changing Climate Research.Click here to view this GAR paper. Seballos and Tanner, 2011 Seballos, F. and Tanner, T. 2011. Child-centred disaster risk reduction. Background Paper prepared for the 2011 Global Assessment Report on Disaster
Risk Reduction. Geneva, Switzerland: UNISDR.Click here to view this GAR paper. In areas in Bolivia that experienced the greatest incidence of extensive disasters, the gender gap in primary education achievement widened, pre-school enrolment rates decreased and dropout rates increased. Equivalent areas in Nepal and Viet Nam saw, respectively, reduced primary enrolment rates and a drop in the total number of children in primary education. Extensive disasters also led to an increased incidence of diarrhoea in children under five years of age in Bolivia, an increased proportion of malnourished children under three in Nepal, an increased infant mortality rate in Viet Nam, and an increase in the incidence of babies born with low birth weight in Mozambique. This study also found evidence of negative impacts in terms of access to water and sanitation in Mexico and Viet Nam. These impacts indicate a need for greater consideration of children’s vulnerability (Box 2.7). Box 2.7 Child-centred approaches to dealing with climate stresses and extreme events
A number of estimates suggest that at least 66.5 million children are affected by disasters annually
(Penrose and Takaki, 2006 Penrose, A. and Takaki, M. 2006. Children's rights in emergencies and disasters. Lancet 367 (9511): 698–699. ; Bartlett, 2008. Bartlett, S. 2008. The implications of climate change for children in lower-income countries. Children, Youth and Environments 18 (1): 71–98. ; Costello, 2009. Costello, A. 2009. Managing the health effects of climate change. Lancet 373: 1693. ; Sanchez et al., 2009. Sanchez, C., Tze-San, L., Young, S., Batts, D., Benjamin, J. and Malilay, J. 2009. Risk factors for mortality during the 2002 landslides in Chuuk, Federated States of Micronesia. Disasters 33 (4): 705–720. ). Addressing high child
mortality rates as well as the significant psychological impacts of disasters on children requires new
approaches that recognize the role of children as agents of change. On the one hand, these approaches
should include child-sensitive policy and programming, where existing social protection, school feeding
programmes and structural strengthening of school buildings all contribute to child welfare. On the
other hand, they extend to participatory DRM policy and programming in which children and young
people are actively engaged in decision-making and accountability processes. These usually have the
benefit of improving communication and integrated planning within communities, and increasingly serve
to promote effective preparation and prevention.. Engaging children in DRM remains constrained by lack of finance, skills and knowledge. This hampers both the processes and delivery of risk management and the engagement of children in planning and decision-making. Also, perceptions of children as passive, subordinate and unable to participate hinder them from actively voicing their risk perceptions, needs and potential. There are examples of how an enabling policy environment can help change this. In the Philippines, the Strategic National Action Plan and the Local Government Code provide a policy environment in which decentralization of disaster risk management responsibilities opens up opportunities for child-centred initiatives. Sangguniang Kabataan are youth councils that are directly involved in decision-making at village level and are represented at municipal, provincial and national levels. However, it is political will and local capacities above and beyond these supporting policies that facilitate child-centred participatory DRM. With external support and guidance, youth groups have made good progress in changing attitudes and providing opportunities for participatory DRM. (Source: Seballos and Tanner, 2011 Seballos, F. and Tanner, T. 2011. Child-centred disaster risk reduction. Background Paper prepared for the 2011 Global Assessment Report on Disaster
Risk Reduction. Geneva, Switzerland: UNISDR.Click here to view this GAR paper. Disasters also contribute to internal displacement (Box 2.8). Hazards such as floods, although causing relatively low mortality, destroy many houses and hence cause considerable displacement. Between 1970 and 2009 in Colombia, for example, 24 of the country’s 35 disaster loss reports detailed floods that killed fewer than 10 people but destroyed more than 500 houses. In total, around 26,500 houses were destroyed, potentially displacing more than 130,000 people. In the Indian state of Orissa, 265 floods with similar low mortality rates destroyed more than half a million houses. Box 2.8 Floods and internal displacement in Tumaco, Colombia
On 16 February 2009, the Mira and Telembí rivers in Nariño, Colombia, flooded four municipalities on
the Pacific Coast: Tumaco, Barbacoas, Roberto Payán and Magüí Payán. Two people were killed, with
a further 20 reported missing, but 1,125 houses as well as schools, health centres, and roads were
destroyed. The government declared a municipal emergency on 23 February in Tumaco, but there was
no international appeal for relief. Based on the number of houses destroyed, there were an estimated 5,625 displaced people. However, the actual number recorded by the authorities was more than 25,000, of whom 14,000 were forced into shelters, with the remainder staying with friends and families. One reason for the discrepancy may be that people whose houses were damaged (but not destroyed) were nevertheless displaced during the peak of the flood. Around 1,400 houses were damaged by the floods, likely generating another 8,000 displaced people. In addition, the number of displaced may include those who evacuated during the floods as a preventive measure, and who most likely returned after a few days or weeks. The number of destroyed houses is therefore more likely to be a better indicator for long-term displacement than for short-term displacement during emergencies. (Source: IDMC, 2010 IDMC (Internal Displacement Monitoring Centre). 2010. Using disaster data to monitor disaster-induced displacement. Background paper prepared for the 2011 Global Assessment Report on Disaster
Risk Reduction. Geneva, Switzerland: UNISDR.Click here to view this GAR paper. Intensive disasters also lead to large-scale internal displacement. Pakistan’s 2010 floods have to date left an estimated 6 million people in need of shelter; India’s 2008 floods uprooted roughly 6 million people; Hurricane Katrina displaced more than half a million people in the United States of America; and Cyclone Nargis uprooted eight hundred thousand people in Myanmar and South Asia ( IDMC, 2010 IDMC (Internal Displacement Monitoring Centre). 2010. Using disaster data to monitor disaster-induced displacement. Background paper prepared for the 2011 Global Assessment Report on Disaster
Risk Reduction. Geneva, Switzerland: UNISDR.Click here to view this GAR paper. Assuming a family size of five in the 21 countries and states included in the GAR11 analysis, the destruction of 5.9 million houses in intensive disasters between 1970 and 2009 would have displaced almost 30 million people. Although extensive disasters account for less than one-fifth (19 percent) of destroyed housing, this implies an additional 7.5 million displaced people, who are typically less visible than those displaced in intensive disasters subject to large-scale international humanitarian assistance. Note 19 Small urban centres are defined as those with
populations of 10,000 to 19,999; medium urban
centres 20,000 to 99,999; large urban centres 100,000
to 999,999 and megacities greater than 1 million. |

| |


 GAR 2011 Contributing Papers