Test your risk blind spots with seven ‘less familiar’ potential cat events
A ‘recency’ bias focused on actual events over the past ten or twenty years, their locations, impacts, and consequences, is a predisposition that can apply to many catastrophe risk managers.
However, we know through stochastic modeling that each actual event is just one sample from a wide range of possible events, which may all be equally likely.
It is certainly helpful to contemplate whether recent catastrophes could have been more or less impactful through small variations in their track, source, or severity, to counter the belief that any actual event is somehow ‘iconic’ and employed for special portfolio analysis or is used as a key benchmark.
But to counter recency bias and develop a more appropriately balanced perspective on catastrophe risk, there is a need to move away from recent events.
To help do this, we have selected seven ‘less familiar’ potential catastrophes, without recent examples, that could each bring significant losses to the (re)insurance market.
Each is intended, realistically, to highlight their catastrophe potential. Through developing and harnessing the hazard footprints of these events, we encourage risk management professionals to discover what the impact would be on their portfolio, should such a catastrophe occur.
Here are our seven ‘less familiar’ potential catastrophe examples:
- A Category 3/4 New England ‘Cape Cod’ Hurricane also hitting Boston
- A severe Central/Eastern Europe flood
- A major earthquake located next to Santiago, Chile
- Flood event impacting industrial parks across Southeast Asia
- Severe multi-territory European Convective Storm
- A re-creation of the ’Great Hurricane of 1780’ through the Caribbean
- New vent volcanic eruption in Auckland
We have endeavored to identify credible events that are not simply replicas of recent catastrophes, and events that may have the potential to be particularly devastating because they are not being prepared for.
This list is not in any particular order and solely focuses on single events rather than event combinations:
1. Category 3/4 New England Cape Cod and ‘Boston’ Hurricane
Our simulated event sees an intense, fast-moving Category 3/4 (Saffir-Simpson Hurricane Wind Scale) borderline storm, (Event ID #31120 in Moody’s RMS® North Atlantic Hurricane Models) with its northerly track comparable to the 1938 hurricane, making landfall further to the east on Cape Cod.
The track continues to the east of Boston bringing Category 2 winds over the city, accompanied by a storm surge that floods many areas of the city.
The parts of Boston that are at the highest risk of flooding include the southern part of the city, the seaport area, and many areas in surrounding towns to the north of the city that border the Mystic and Chelsea Rivers.
A report recently published in the journal GeoHealth has also highlighted the potential impact of hurricane flooding on medical facilities in and around the city.
The last hurricane to affect Boston was Hurricane Bob in 1991. However, the losses from our simulated event, with its damaging windspeeds extending over Boston, are much higher, in the multiple tens of billions of dollars.
Although more like a 1-in-100-year loss for the Northeast U.S., this is closer to a ‘ten-year’ loss for the whole U.S.
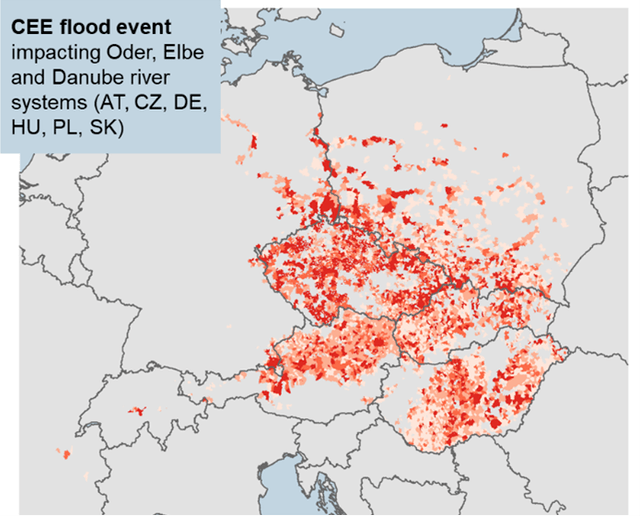
2. Central and Eastern Europe Flood
A simulated summer flood event (Event ID #4108900 in the Moody’s RMS Europe Flood HD Models) reflects a long-lasting period of intense rainfall on previously saturated ground, producing a combination of pluvial and fluvial flooding, with river defenses being locally breached and, in some cases, overtopped.
The countries impacted include Austria, Czech Republic, Germany, Hungary, Poland, and Slovakia, with rainfall totals exceeding the 500-year return period in some locations.
However, at a pan-European level, this event has lower than a 50-year return period, with a total insured loss of about 15 billion euros.
Flood events that span large areas of Germany, Poland, and the Czech Republic are not uncommon. There is the potential for high levels of precipitation across a large area of central Europe, brought by an ‘atmospheric river’ sourced over the Gulf of Genoa.
Cyclones propagating from Genoa into central Europe are designated ‘Vb’ (after van Bebber 1891). Forty-five percent of Vb cyclones are associated with heavy precipitation in the summer, and strong Vb cyclones have also had the highest residence time.
Such flood events include those in July 1997, August 2002, and June 2013, all events spanning several central European countries and causing billions of euros in insured losses.
Despite local upgrades in flood defenses, increases in population, exposed values and penetration of insurance mean that a repeat of any of such events would bring high levels of insured loss.
Once the excess precipitation accumulates in the major rivers, like the Elbe and the Oder, flooding can pass from one riverside city to the next, even affecting locations that may not have received the highest rainfall.
3. Santiago Earthquake
A major shallow earthquake sourced next to Santiago, the capital city of Chile, could have disastrous consequences for the region. Chile is located on the ‘Pacific Ring of Fire,’ with the Pacific subduction zone running offshore and parallel to the western coastline.
While most earthquakes are located close to the easterly dipping plate boundary, which is approaching 100 kilometers (62 miles) deep beneath the capital city, there are also active faults within the South American plate linked to the creation of the Andean Mountain chain, including close to the capital Santiago.
Our example event is up to M7.3 (included in Moody’s RMS Chile Earthquake Model) and is located next to Santiago (pop. ~5.6 million).
It is based on the dimensions of the 30-kilometer (18.6 mile) San Ramón thrust fault line that lies at the base of the mountains to the east of the plain in which most of the city is located.
An earthquake would be accompanied by debris flows and rockfalls on the mountain slopes, which also include some of the wealthiest suburbs of Santiago. The surface trace of the fault cuts through recently developed residential neighborhoods.
Such a powerful and shallow earthquake could result in widespread damage to infrastructure in this capital city, including to buildings, roads, and utilities.
The insurance impact could also be substantial, as much of the higher-value commercial, industrial, and private housing exposure is insured.
4. Southeast Asia Industrial Parks Flooding
Flooding in Southeast Asia is common, often causing disruptions and severe damage locally, but due to the low insurance penetration rate, the insured losses are normally attritional.
However, there are exceptions such as the 2011 flood in the Chao Phraya basin (Thailand) which inundated five large industrial parks specializing in automotive and computer hardware, flooding 97,000 square kilometers (37,451 square miles), and more than three million structures.
These floods lasted up to five months, and brought US$16 billion of insured losses, due to the large proportion of insured foreign-owned assets.
About 90 percent of these losses occurred in commercial lines and about 35 percent were related to (contingent) business interruption, driven primarily by the significant levels of foreign direct investments and the disruption to global supply chains.
Losses were also amplified by the earlier Tōhoku earthquake and tsunami in Japan (March 2011) because Thailand was the alternative supplier location for many Japanese manufacturing companies whose supply chains had been affected by the Japanese earthquake.
While losses such as the 2011 Thailand floods would not be repeated today because of the investment in flood walls around the principal industrial parks and the tightening of policy wording limiting contingent business interruption, Southeast Asia can still generate flood events that would bring some mid-size single-digit billion dollar insured losses.
This is particularly true given the potential monsoon-driven correlation that spans Indonesia, Malaysia, Singapore, and Thailand, coupled with the concentration of exposure in large, high-tech industrial parks, often located close to major rivers.
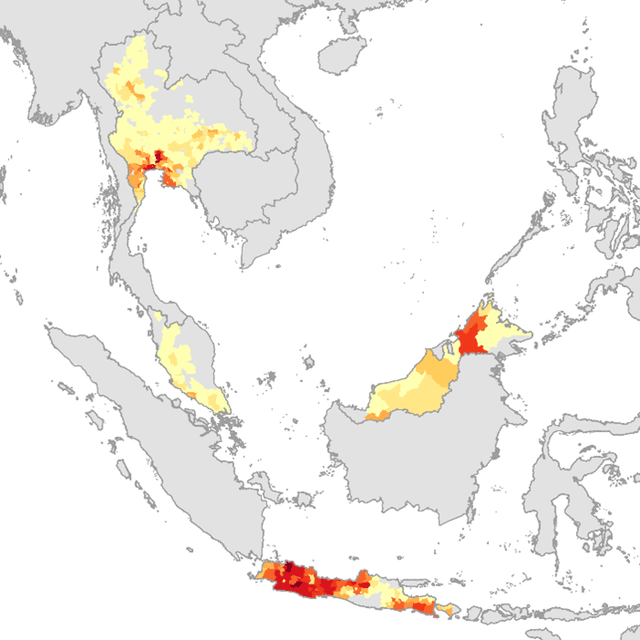
Our potential event sees a monsoon driven by intense rainfall persisting for several weeks, (Event ID #51229033 in Moody’s RMS Southeast Asia Flood HD Models) leads to a combination of pluvial and fluvial flooding, with river defenses being locally breached and, in some cases, overtopped.
Countries impacted include Indonesia, Malaysia, Singapore, and Thailand, with a total flood extent of about 50,000 square kilometers (19,305 square miles).
In most countries, the local hazard severity is extreme, with a hazard-based return period that in some cases exceeds 500 years. However, at the overall Southeast Asia level this US$4 billion loss event should be expected to occur at a much higher frequency, below 50 years.
5. Severe European Convective Storm
Severe convective storms can bring a range of hazards including, tornadic winds, straight-line winds, intense rainfall, lightning, and most damaging of all, large hailstones. The larger and more intense the storm the more destructive can be these hazards.
In Europe, severe convective storm events tend to form close to mountain ranges, e.g., the Alps, the Pyrenees, etc., as the mountains provide the lifting mechanism necessary to trigger convection.
The typical European severe convective storm season spans from April to September, with a peak during the summer months, and intense storms frequently occur in a cluster of parallel tracks. When impacting urban areas, hail and wind can cause several billion euros of damage.
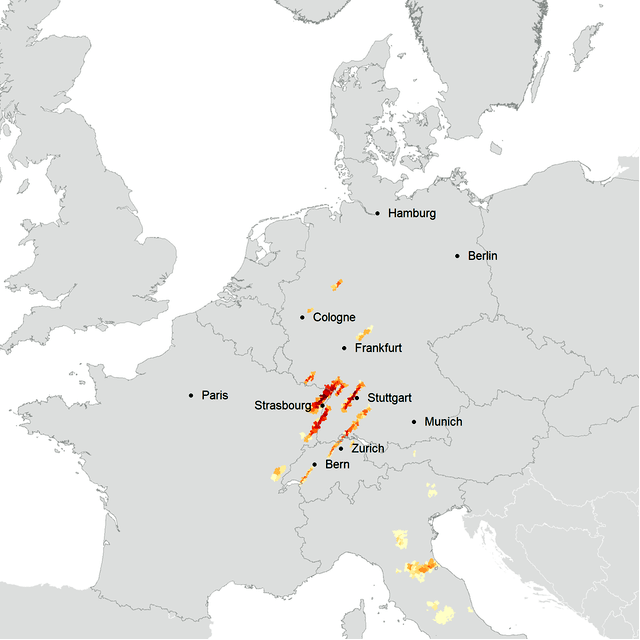
Our simulated event is over a single day at the end of June, where several severe hail streaks hit densely populated areas in Germany, France, and Switzerland, including the cities of Stuttgart, Karlsruhe, and Strasbourg.
Hailstones up to 12 centimeters (4.7 inches) in diameter in Germany, 10 centimeters in France, and six centimeters in Switzerland are reported.
This event corresponds to Event ID #48834272 in Moody’s RMS Europe Severe Convective Storm HD Models, and the loss return period of this event for a European portfolio can be below 1-in-30 years.
With an overall insured loss of 3-3.5 billion euros for this event, losses can be broken down by country, with Germany at less than a two-billion-euro loss, France at around one billion euros, and Switzerland at around a 200-million-euro loss.
6. Great Hurricane of 1780 Simulation
The Great Hurricane of 1780 caused the highest loss of life of any Atlantic hurricane, and from the levels of destruction, we can infer windspeeds on Barbados and St Lucia were high Category 5, comparable to Hurricanes Irma and Maria.
Causing considerable destruction over western Martinique, it made a direct hit on the small island of St. Eustatius, before moving more westerly over Puerto Rico and eastern Hispaniola.
This is worth investigating as in particular, Barbados has not experienced a Category 5 hurricane for more than a century, and we can expect very high levels of loss.
Exploring stochastic tracks in the Moody’s RMS Caribbean Hurricane Models, Storm Event ID #47668 shares some of the principal characteristics in terms of intensity/geography and is a good match for the hurricane over Barbados and St. Lucia, while also reflecting very significant windspeeds and losses in Puerto Rico.
Just as the 1780 storm led to the highest loss of life of any hurricane, we should not be surprised that the loss return period of our selected event, when considering losses only in the Caribbean, is beyond 250 years.
7. Auckland Eruption
The city of Auckland on New Zealand’s North Island is spread across many hills – the cones and craters of a scatter of small, geologically recent, volcanoes. The earliest eruption was 193,000 years ago while the most recent, and one of the largest, was 600 years ago, which erupted 0.7 cubic kilometers of basaltic lava on Rangitoto Island, just a few miles northeast of the city.
With fifty-three eruptive centers identified in and around Auckland, most have only had a single episode of eruption. The average time separation between eruptions has been about 3,500 years, (or 2,500 years over the past 50,000 years) but some intervals have been shorter.
Our simulated event of a potential next eruption could begin with a cluster of shallow seismic activity close to Waitemata Harbor, the main port for New Zealand.
Three levels of impact can be expected in response to a new eruption:
- People will need to be evacuated within a wide area around the vent. This could be for up to, or more than, a year. The evacuation zone may have to be expanded as the eruption continues. The city’s airport is likely to be closed as flying into ash clouds will be deemed too risky. Insurance losses could cover interrupted business and alternative living expenses.
- In the areas subject to ash fall within the evacuation zone, roofs cannot be cleared and follow-on damage is expected from excess load on roofs, as well as rapid oxidation of metal surfaces.
- Close to the new vent there may be complete destruction of properties and their abandoned contents.
While Moody’s RMS does not have a released eruption model for the country, we have undertaken sensitivity analysis for the losses that would be incurred for eruptions in and around Auckland, for physical loss and other insured costs covering business interruption and alternative living expenses.
As the national Earthquake Commission (EQC) insurance policy in New Zealand covers volcanic eruption, the results of pre-existing analyses are useful to explore the contribution to tail EQC losses from eruptions in New Zealand.
With more surprises occurring – whether it is more intense or frequent weather-related events, tail risk events in heavily populated areas, or events that are not usually on the risk manager’s radar, we think it pays to explore further and overcome potential recency bias.