Storm surge

A storm surge reflects the difference between the actual water level under the influence of a meteorological disturbance (storm tide) and the level which would have occurred in the absence of the meteorological disturbance (WMO, 2008, 2011, 2017).

A storm surge is the rise in seawater level caused solely by a storm. It is the abnormal rise in seawater level during a strom, measures as the height of the water above the normal predicted astronomical tide. The surge is caused primarily by a storm's winds pushing water onshore.

Storm surge should not be confused with storm tide. A storm tide is the water level that results from the combination of the storm surge and the normal (astronomical tide).

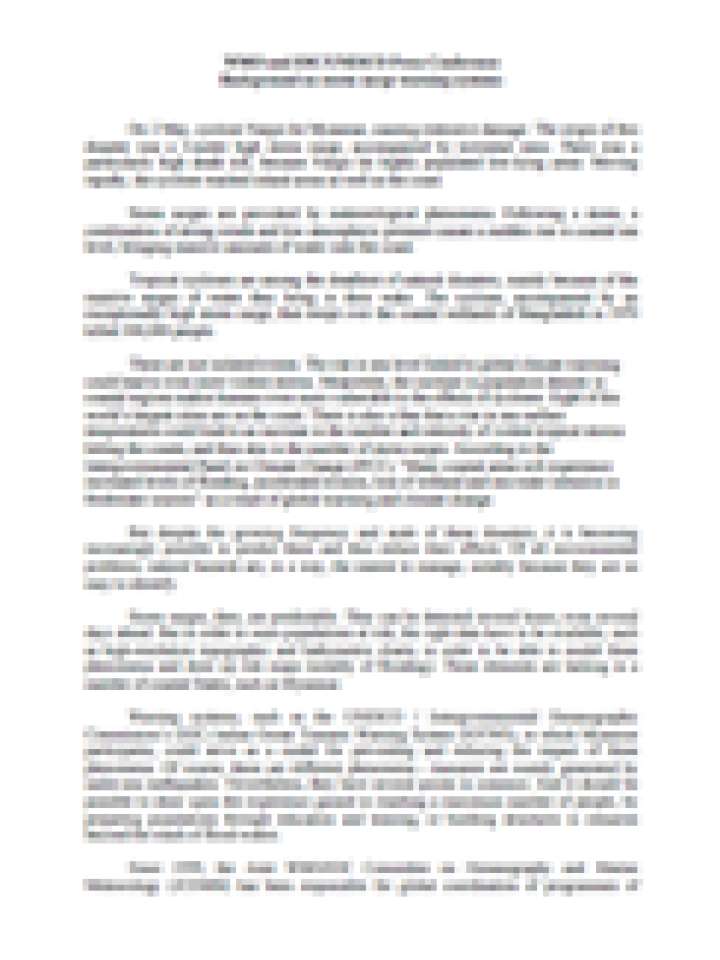
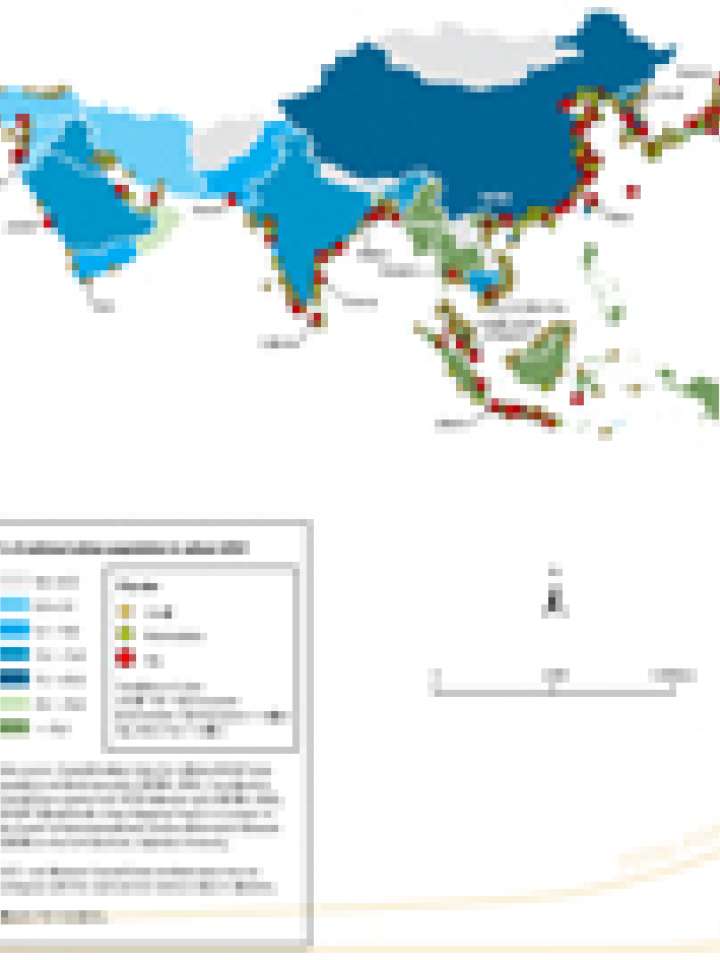
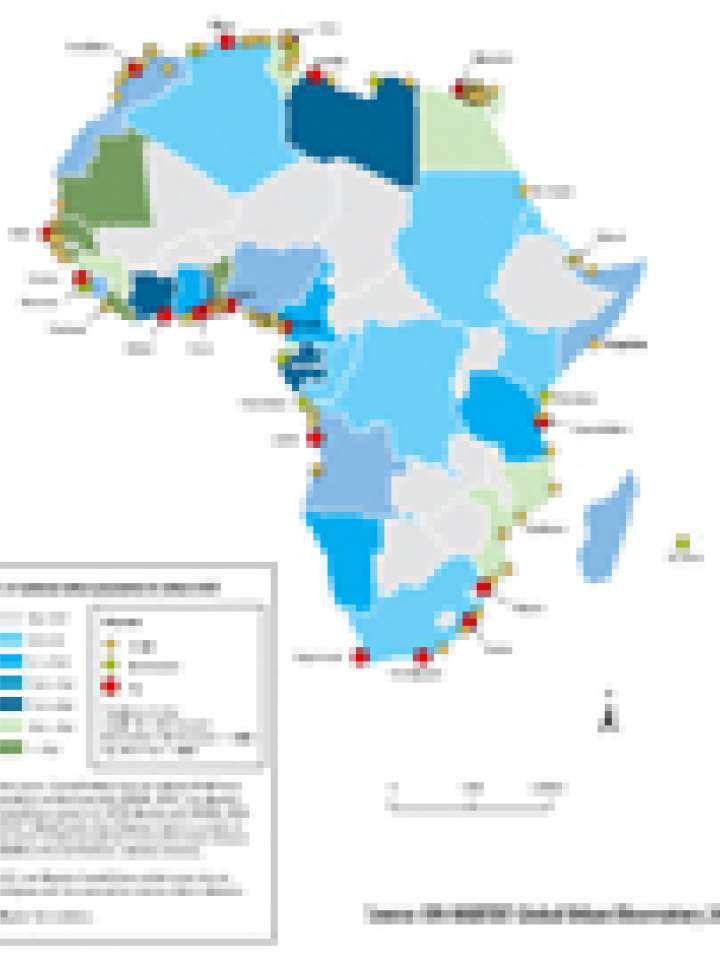
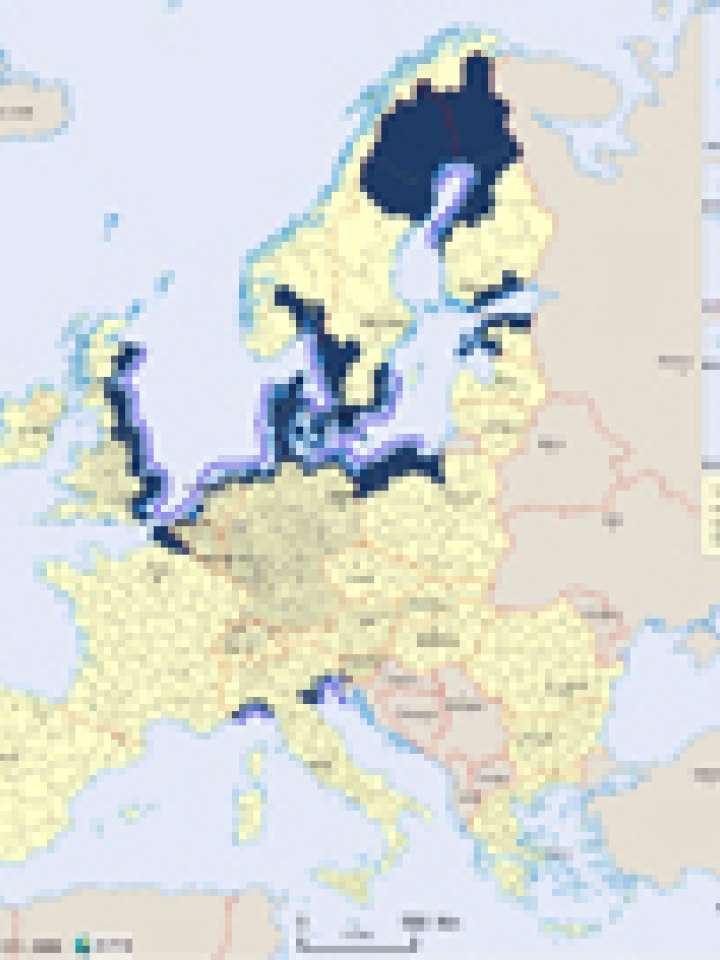
This rise in water level can cause extreme flooding in coastal areas, resulting from storm tides reaching up to 6 meters (20 feet) or more in some cases (NOAA, 2019b.) On top of a strom tide are pounding waves generated by the powerful winds. The area of seawater flooding may extend along the coast for over 100 km, with water pushing several kilometres inland if the land is low lying. The combined effects of the storm tide and surface waves can destroy buildings, wash away roads and run ships aground (Australian Government, 2020).

Examples of National Alerting Parameters include storm surge warning issued in Canada (Government of Canada, 2019) and an Advisory for storm surge watch/warning issued by the World Meteorological Organization (WMO, 2017).

Latest Storm surge additions in the Knowledge Base

Extensive logging and mining are being blamed for severe flash-floods that submerged large parts of the southern island of Mindanao this month...
The New Humanitarian
'This is where we bested other areas in terms of capability in meeting disaster challenges and mitigation measures.' said Albay Governor, Joey Salceda...
Philippine Information Agency

This document provides background information about storm surge, early warning systems, and the practical application of these tools during the destruction of Cyclone Nargis.

The map highlights cities in Asia at risk due to sea-level rise, and their dimension.

In the 20th century, sea levels rose by an estimated 17 centimetres, and the conservative global mean projections for sea-level rise between 1990 and 2080 range from 22

The map highlights cities in Latin America and the Caribbean at risk due to sea-level rise, and their dimension.

In the 20th century, sea levels rose by an estimated 17 centimetres, and the conservative global mean projections for sea-level rise between

The map highlights cities in Africa at risk due to sea-level rise, and their dimension.

In the 20th century, sea levels rose by an estimated 17 centimetres, and the conservative global mean projections for sea-level rise between 1990 and 2080 range from

“The strong tropical cyclone in Louisiana and Mississippi, as well as the devastating floods in Romania, Bulgaria, Switzerland, Austria and Germany are yet another reminder that natural hazards are a global threat. We need to pay more attention to social
United Nations Office for Disaster Risk Reduction
This map shows the approximate probability of having storm surges in any NUTS3 cluster. As storm surges are often closely linked to winter storms, the very high hazard area is mainly located in the areas where winter storms occur.
Bookshelves in a library.
Explore the Knowledge Base
Explore the latest on disaster risk and resilience from around the world: news, research, policies and publications.

Is this page useful?

Yes No Report an issue on this page

Thank you. If you have 2 minutes, we would benefit from additional feedback (link opens in a new window).