Reading the leaves to track environmental hazards and health
The USA National Phenology Network is small but mighty, helping scientists and resource managers assess natural hazards and seasonal phenomena that affect society in numerous ways.
By Theresa M. Crimmins
Record-shattering fires in Australia, in the western United States, and elsewhere in recent years have repeatedly brought forest management and wildfire risk to the forefront of public attention. In 2020, roughly 4.2 million hectares (10.3 million acres) burned across the United States—with more than 1.6 million hectares (4 million acres) burning in California alone—far outpacing the annual average from recent decades. As risks to infrastructure, public health, wildlife, and ecosystems from fires and other hazards grow and evolve, researchers and land management officials are turning to every available tool to help assess, forecast, and mitigate these risks. Plants and animals can be powerful allies in this effort.
The timing of recurring seasonal activities of plants and animals, such as when plants green up, flower, and later brown each year, is both an integrator and an indicator of environmental conditions. The timing of recurring seasonal activities of plants and animals, such as when plants green up, flower, and later brown each year, is both an integrator and an indicator of environmental conditions and can contribute valuable information about fire risk and management. Phenology, the field that studies these natural cycles, is an explicit component of a wide range of scientific and management applications related to wildfires and other public health issues, for example, at local to global scales.
The USA National Phenology Network (USA-NPN) is a national-scale monitoring and research initiative based at the University of Arizona. USA-NPN focuses on collecting, organizing, and delivering research-grade phenological data, information, and forecasts to support scientific discovery, human health, agriculture, the sustainability of natural resources, and education. Since its establishment in 2007, USA-NPN has grown into a high-impact enterprise with support primarily from various federal agencies, most notably the Ecosystems Mission Area of the U.S. Geological Survey. The program offers a geographically extensive and taxonomically rich data set of plant and animal phenology; maps and forecast products; decision support tools; and data collection, management, access, and exploration tools. Land management agencies, research scientists, policymakers, the news media, and the public rely upon these free, readily accessible resources to support discovery and decision-making in a wide range of ventures.
Despite the program’s successes and valuable contributions to science and society, USA-NPN and its resources are in jeopardy after federal funders—facing internal budget reductions of their own—unexpectedly cut support for the network’s fundamental infrastructure by 75% last year and staff and capacity were dramatically reduced. These reductions have resulted in contractions of development and innovation as USA-NPN has scrambled to sustain its core services.
As I describe here, phenology data and information offer distinct benefits for efforts aimed at addressing a myriad of pressing Earth sciences concerns—efforts that could be acutely affected if USA-NPN, the premier national-scale phenology program in the country, is lost.
Rapid Wildfire Risk Indicators
Although climate governs the accumulation and flammability of fuel for wildfires over decadal and longer timescales, various aspects of fires—including their timing, intensity, and size—are shaped by the timing of seasonal events such as plant leaf-out and senescence. For example, an earlier onset of warm spring temperatures, which triggers an earlier start to spring biological activity, is more likely to increase wildfire activity. Early snowmelt encourages lush plant growth early in the season, which generates more fuel as soils and vegetation dry out later in the season [Westerling et al., 2006; Westerling, 2016]. Further, because the timing of events like flowering is strongly shaped by local environmental conditions, phenology can provide readily observable indicators of physiological conditions such as water stress in plants [Kemp, 1983].
One of the most important factors contributing to wildfire risk is plant moisture content, which is quantified as live fuel moisture—the amount of water in living plants relative to their dry weight. When live fuel moisture falls below the critical threshold of 79%, area burned following ignitions increases dramatically, making it a critically important variable to measure over the course of a fire season.

In this view of the 2007 Griffith Park Fire in Los Angeles, the lights of Hollywood are visible at right. Phenology data provide a means of forecasting the risk of wildfires such as this one. Credit: Eric Castro, CC BY-NC-SA 2.0
Traditional approaches for estimating live fuel moisture involve clipping and drying vegetation samples and interpreting remotely sensed imagery. Clipping approaches are difficult to undertake in remote locations and suffer from delays between when samples are collected and when results are available after they are dried and weighed in a lab. Assessments based on remotely sensed information, meanwhile, can provide more immediate results but suffer from inherent imprecision resulting from the relatively low resolution and mixed signals from different plants present in individual pixels. Visually assessing the phenological status of individual plants offers a third option for determining moisture status—and therefore risk of ignition—in vegetation. This option is simple and cost-effective to implement, and it offers immediate results.
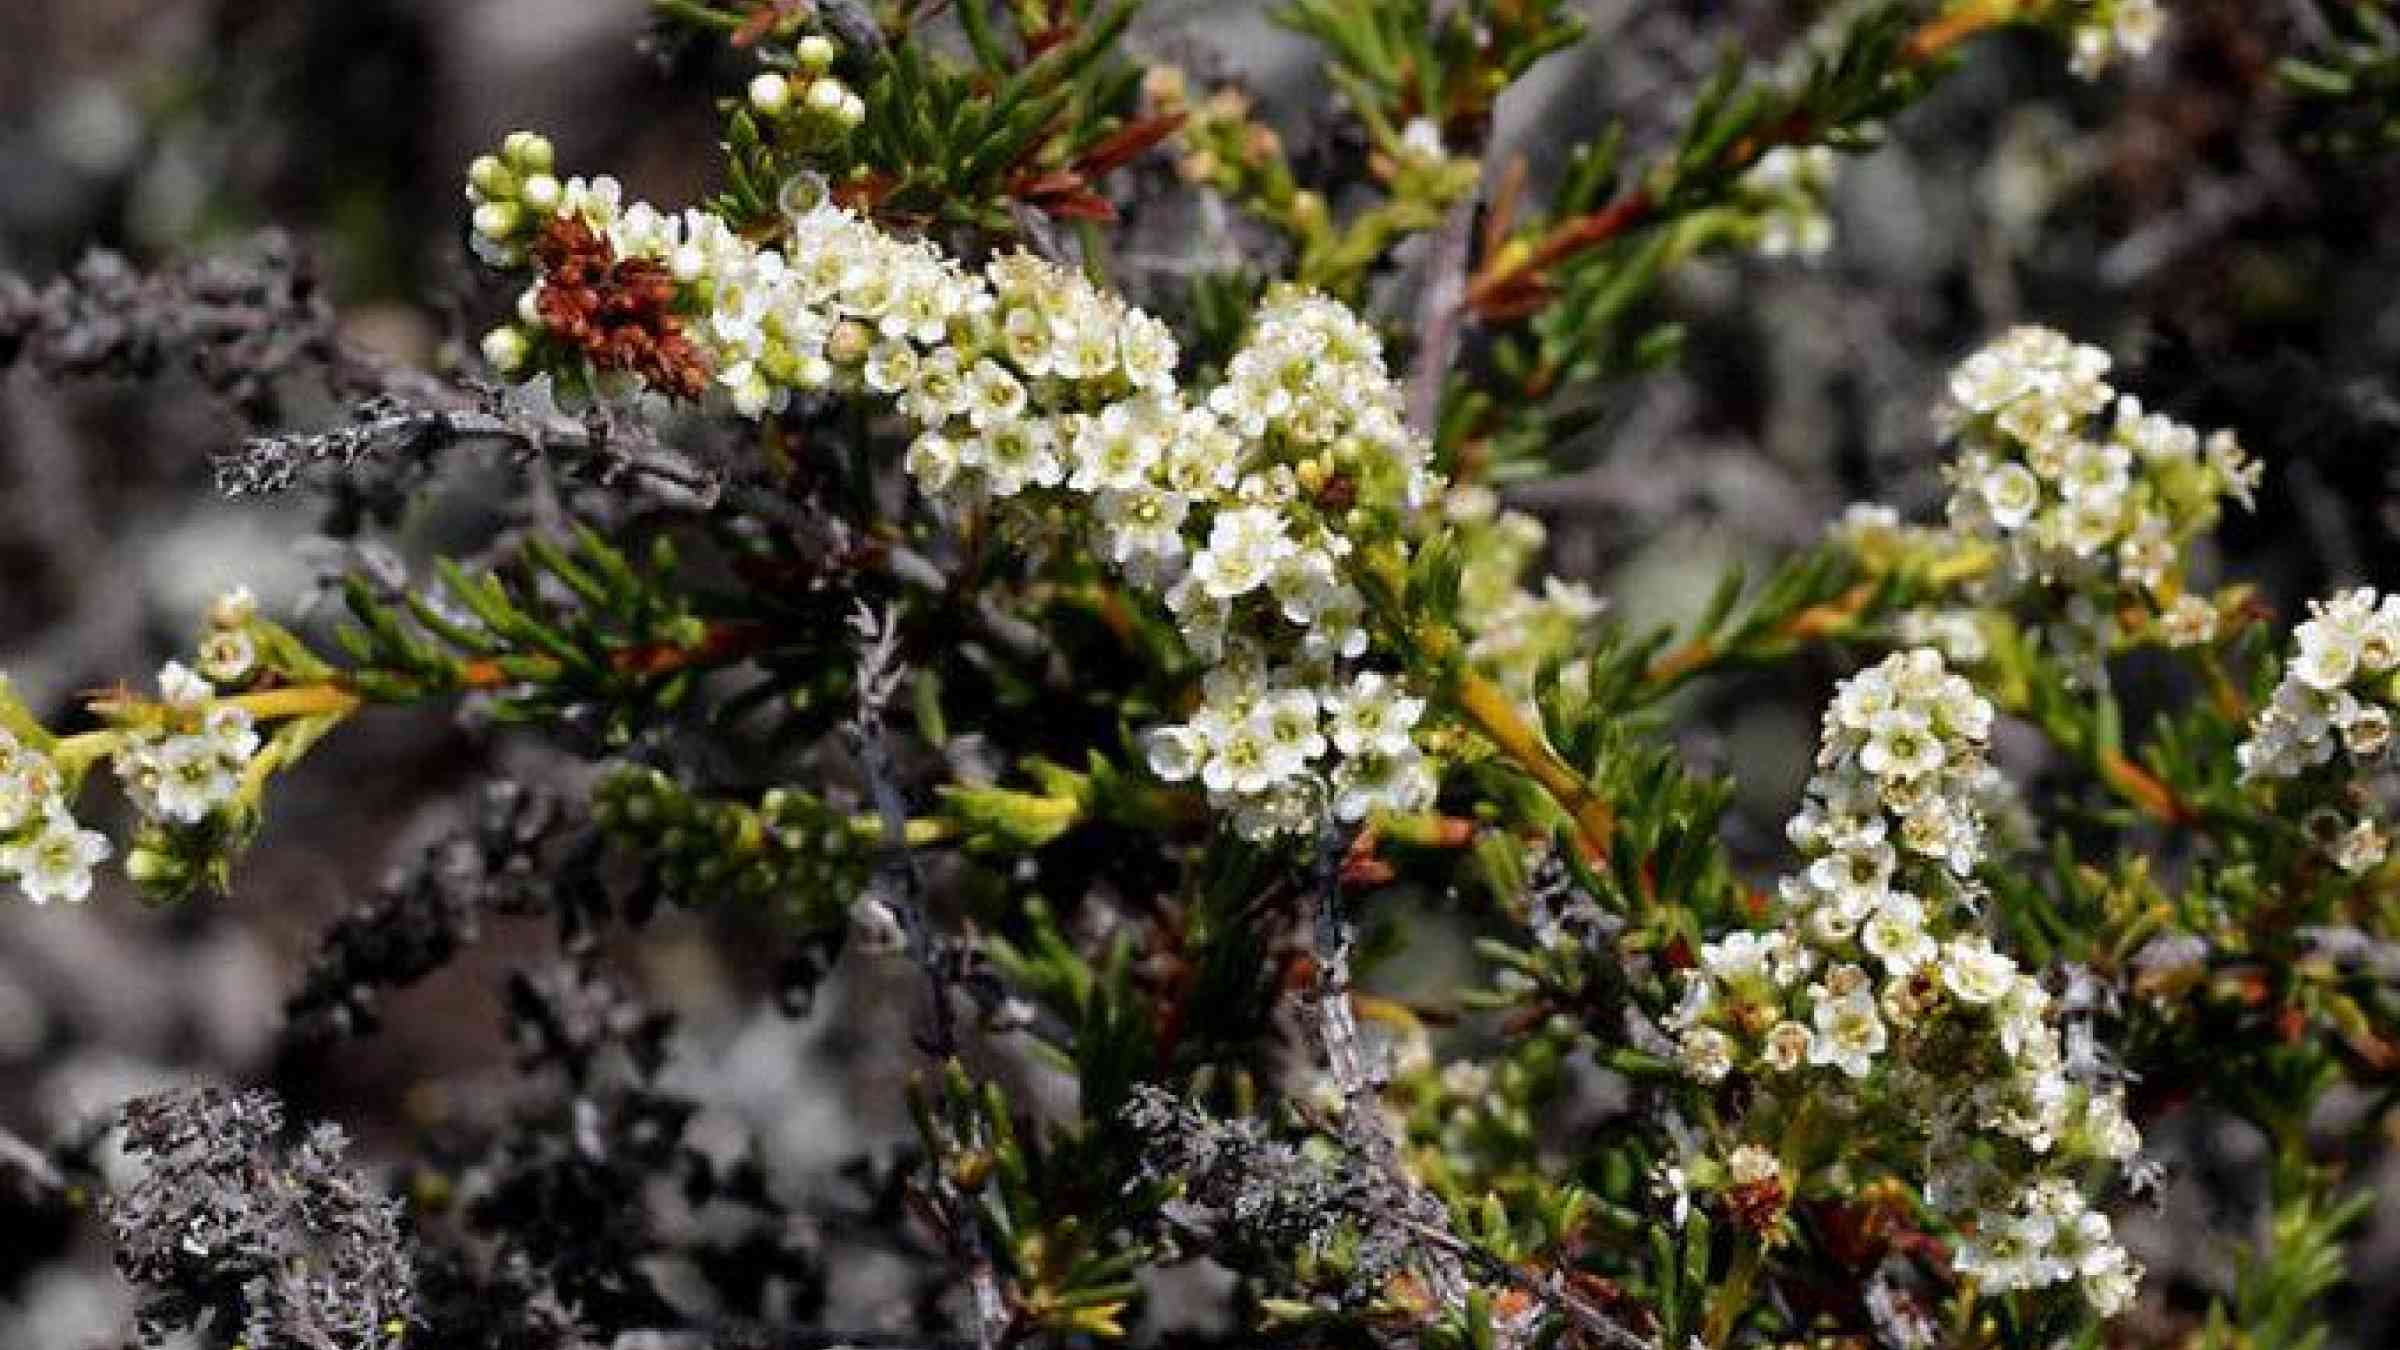
Nathan et al. [2020] demonstrated the untapped potential to use plant phenological status as an indicator of live fuel moisture. These researchers examined observations of plant phenology contributed by volunteers to Nature’s Notebook, the phenology observation program maintained by USA-NPN. They determined that chamise (Adenostoma fasciculatum), a common and widely distributed plant in chapparal ecosystems in fire-prone California, crosses below the critical live fuel moisture threshold of 79% after the plant has flowered but before fruits have developed.
With this knowledge, resource managers can easily and inexpensively assess live fuel moisture status in chapparal simply by looking at the flowering and fruiting status of chamise. The freely and readily available phenology data in Nature’s Notebook likely hold many more yet-to-be-discovered keys that can similarly support fire science, risk assessment, and management planning.
Seasonal Events and the Upper Atmosphere
An unusually early or late start to spring has wide-ranging societal, economic, and environmental repercussions. For example, it can affect when snow and ice disappear, when leaf buds appear, and when bumblebees and bats emerge from hibernation. If springtime warmth arrives early, trees begin budding early, putting vulnerable crops such as cherries, peaches, and pears at significant risk of damage from subsequent frost events. Likewise, an early start to the season can cause a higher incidence of pollen-related allergies and asthma hospitalizations [Sapkota et al., 2020]. Communities can also lose tourism income if spring festival schedules—planned to coincide with typical emergence times of, say, tulips, lilacs, or cherry blossoms—don’t match up with the flowers’ actual appearance.
Much of the year-to-year variation in winter and spring temperatures on Earth’s surface and, consequently, variation in the timing of springtime plant and animal activity are driven by upper level atmospheric patterns. These patterns include large-scale circulation and sea surface temperature modes such as the El Niño–Southern Oscillation (ENSO), the North Atlantic Oscillation (NAO), and the Pacific Decadal Oscillation (PDO) [McCabe et al., 2011; Ault et al., 2015]. The position of the Northern Hemisphere jet stream, a related phenomenon, also demonstrates strong concordance with the timing of early spring leaf-out [Belmecheri et al., 2017].
Relationships between these atmospheric patterns and springtime plant and animal activity arise because large-scale circulations and modes indicate persistence in warm and cool air masses. Persistent air masses govern the winter and spring season surface air temperatures to which organisms are exposed and, therefore, the timing of their seasonal activity.
For example, the NAO is in a positive phase when the subpolar low and the subtropical high air pressures are stronger than average. The positive phase of the NAO results in fewer cold periods and storms in the eastern United States, a more poleward Northern Hemisphere jet stream, and an earlier start to spring in the eastern United States [Belmecheri et al., 2017]. In contrast, a negative phase for the NAO is associated with the jet stream having more amplified troughs and ridges, colder spring weather, and delayed leaf-out in the southeastern United States. Likewise, positive phases for ENSO and PDO, characterized by warm eastern Pacific Ocean sea surface temperatures, are linked to low pressure in the southeastern United States and result in a later start to spring [Belmecheri et al., 2017].
These relationships between large-scale circulations and vegetation have been established almost entirely using historical observations of lilac and honeysuckle leaf-out and flowering maintained by USA-NPN [Rosemartin et al., 2015] and with the network’s spring index maps, which estimate the onset of springtime biological activity across the conterminous United States.
Concordance between atmospheric phenomena and springtime phenological responses assists researchers and managers in making predictions about the likelihood of anomalous conditions associated with risks to crops, for example, or with increased emergency room visits caused by pollen-triggered asthma. This predictive capacity underscores the value of the data and information products offered by USA-NPN.
Validating Satellite Sensing from the Ground
The ground-based observations maintained by USA-NPN are also indispensable for scientists in analyzing data from satellite-borne sensors. Over the past decade, many studies have used these observations to interpret remotely sensed imagery.
Phenological observations and remote sensing are frequently used together to estimate changes in the timing and length of the growing season, for example. Chen and Yang [2020] recently used ground observations of plant phenology from USA-NPN, Europe’s Pan European Phenology program, and Canada’s Nature Watch program to estimate the accuracy of two satellite-derived start-of-season measures over the Northern Hemisphere. The authors reported that since 2001, the start of season has shifted earlier by more than 2 days per decade at middle and high latitudes, whereas it has been delayed at low latitudes. These results showing variable rates of advancement in the start of the growing season with geography are consistent with those from other studies that have also used USA-NPN phenology observations [e.g., Yue et al., 2015; Peng et al., 2017].
An Imperiled Resource
Research and natural resource management efforts like those described above rely on both current data and unbroken historical records. Loss of USA-NPN’s observational phenology data resource and the real-time maps, short-term forecasts of the timing of springtime biological activity, data access and visualization tools, and interpretive and curriculum materials it provides would be a significant blow for scientists across many disciplines and for educators, resource managers, and the public.
The demise of the phenology data collection carried out through Nature’s Notebook would also be a significant loss. This program can continue to offer significant value in scientifically and societally important applications. And because of the volunteer nature of the data collection, it may help offset data gaps from the past year associated with the shuttering of formal monitoring in such programs as the Long Term Ecological Research Network and the National Ecological Observatory Network because of disruptions from COVID-19.
Continuing support for USA-NPN, now and in the future, is vital for preserving this one-of-a-kind, national-scale phenology data resource.
Continuing support for USA-NPN, now and in the future, is vital for preserving this one-of-a-kind, national-scale phenology data resource. Without it, we will lose out on many of the insights into nature that plants and animals provide and forfeit a crucial tool in our efforts to adapt to our ever changing environments and the risks they pose.
As with other long-term ecological monitoring efforts, the only viable path for sustaining the program is through a permanent federal commitment to cover at least basic operating costs. Over the past year, USA-NPN has sought grants, donations, and institutional support from other funders to help cover these costs, but these efforts have dramatically reduced our small team’s capacity to carry out the program’s primary functions.
Interested readers can contact their congressional representatives and request that funding be restored for USA-NPN. Engaging with this program by using the phenology data, contributing observations through Nature’s Notebook, using program curricula in your classroom, and visiting the website to learn more are also ways to demonstrate your support and enthusiasm for the effort.