Please help us improve PreventionWeb by taking this brief survey. Your input will allow us to better serve the needs of the DRR community.
USA: Eastern San Joaquin Valley and other California drinking water supplies at risk in the next drought
By Amanda Fencl, Rich Pauloo, Alvar Escriva-Bou, and Hervé Guillon
During the 2012-2016 drought, the state received more than 2,500 domestic well failure reports, the majority of which were in the Central Valley (DWR 2018). This left thousands of people without a reliable source of drinking water for months and, in some cases, years. The crisis drew national attention as well as local and state investment and intervention in many communities.
The next drought might be just around the corner, pushing farmers and cities to pump more water from the ground again, and risking the primary water source for the estimated 1.44 million Californians that rely on domestic wells for drinking water and household use (Dieter et al. 2018). These people are responsible for maintaining their own water supply; during droughts, they are “first to suffer […] in cabins in Modoc County, among … the hills of Paso Robles, in the farmworker towns of the San Joaquin Valley” (Santa Cruz Sentinel 2014). Would we be ready to deal with the next crisis? Can we plan in advance to avoid such problems?
One of the ways to be better prepared is by strengthening rural drought resilience and identifying who is at risk and vulnerable to experiencing domestic well failure. As part of the 2018 #CAWaterDataChallenge, our team created a tool-oriented research product that addresses three specific questions:
- Which domestic wells will be vulnerable in the next drought?
- Are disadvantaged households disproportionately affected by drought-vulnerable wells?
- Can we identify characteristics of the vulnerable wells that will worsen with climate change?
Our submission was driven by open data from public agencies and assessed the vulnerability of domestic wells to failure in the Central Valley. Using the Department of Water Resources’ (DWR) seasonal groundwater level measurements, we interpolated groundwater levels in the shallow to semi-confined Central Valley aquifer system. Then, a spatial model of well failure was built and calibrated to actual, reported well failures collected by the state during the 2012-2016 drought (DWR 2018). The spatial point pattern of our model’s predicted well failure during the 2012-2016 drought matched observed well failure point patterns reported to the state as dry or failing wells.
Additionally, more than half of the well failures in SDACs were less than one mile from the nearest water system, suggesting that connecting households with failed wells to a nearby water system is a potential long-term solution. Many households with domestic wells that failed are isolated and rural, as shown by the points in this box plot, and anywhere from 2.5 – 7.5 miles from their closest community water system.
Which domestic wells will be vulnerable in the next drought?
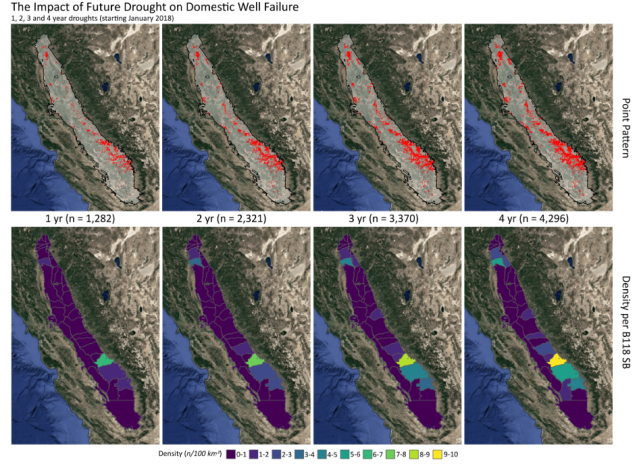
Assuming no interim intervention to resolve existing or prevent new well failures, our project shows where domestic wells are vulnerable in future droughts. A well fails when the groundwater level in a drought scenario falls below the level of the pump. We simulate 1-, 2-, 3-, and 4-year-long droughts by scaling the observed (2012-2016) 4-year groundwater level change. Due to already low groundwater levels, a simulated a 4-year-long-drought starting in January 2018 would result in more than 4,000 domestic well failures in the Central Valley alone, nearly twice as many well failures compared to 2012-2016. The eastern San Joaquin Valley (especially Fresno, Tulare and Madera counties) and small areas in northern basins are the most susceptible to domestic well failure.
Are disadvantaged households disproportionately affected by drought-vulnerable wells?
To understand the socio-economic conditions of those impacted by well failure, we assign 2016 census block group Median Household Income values to domestic wells located within that block group. We then calculate the distance between failed wells and the nearest community water system. Initial findings indicate that 2012-2016 drought disproportionately impacted domestic wells found in low-income areas. About 1.5 times more well failures were reported by households in disadvantaged and severely disadvantaged communities (DAC + SDAC together) compared to those at or above the Median Household Income (MHI+).
Additionally, more than half of the well failures in SDACs were less than one mile from the nearest water system, suggesting that connecting households with failed wells to a nearby water system is a potential long-term solution. Many households with domestic wells that failed are isolated and rural, as shown by the points in this box plot, and anywhere from 2.5 – 7.5 miles from their closest community water system.
Can we identify characteristics of the vulnerable wells that will worsen with climate change?
Results from the spatial model of well failure were used to train an ensemble machine learning classifier on 56 climatic and geologic variables to predict present day well failure across the Central Valley and assess the climatic controls on domestic well failures. Preliminary results indicate that well failure is associated with higher temperatures in the spring, fall, and summer. This work is ongoing and will be further refined to identify which areas will likely be most at risk in the future; providing information for policymakers and stakeholders to make informed decisions in preparations for the next drought.
We can’t avoid another drought in California. But we can work to anticipate its potential impacts, plan proactively, and avoid its consequences. Our research provides a framework to deal with one of the worst effects of the latest drought – thousands of people running out of water in one of the richest regions of the world. Our hope is to show local and state decision-makers what is possible with existing data and methodologies to proactively address drinking water issues in California’s rural communities.
Explore further
Please note: Content is displayed as last posted by a PreventionWeb community member or editor. The views expressed therein are not necessarily those of UNDRR, PreventionWeb, or its sponsors. See our terms of use
Is this page useful?
Yes No Report an issue on this pageThank you. If you have 2 minutes, we would benefit from additional feedback (link opens in a new window).