Global Assessment Report on Disaster Risk Reduction 2015
Making development sustainable: The future of disaster risk management |
Global Assessment Report on Disaster Risk Reduction 2015
Making development sustainable: The future of disaster risk management |
|
|
62
Part I - Chapter 3
In terms of income groups, annual capital investment is around 10 times greater in high-income countries than in lower middle-income countries. However, relative to capital investment, the AAL of these regions is comparable, indicating that lower middle-income countries will be more challenged to achieve their development goals (Figure 3.9).
In such circumstances, it is impossible to achieve sustained, let alone sustainable, growth. For example, in Asia, Myanmar’s AAL represents 30 per cent of its annual capital investment and in the Philippines and Cambodia 14 per cent and 10 per cent respectively. In Latin America, for Honduras and Guatemala the AAL represents almost 18 per cent and around 10 per cent of new capital investment, respectively.
Disaster risk also challenges social development. While social expenditure in absolute terms is
lowest in South Asia, the region’s AAL is equivalent to more than 10 per cent of that expenditure. Disaster risk thus threatens the capacity for social expenditure precisely in those countries with the least capacity and the greatest need to invest. For example, social expenditure in sub-Saharan Africa is little more than 1 per cent of that in East Asia and the Pacific, or around 3 per cent of that in Latin America and the Caribbean. However, the AAL in sub-Saharan Africa is equivalent to almost 3 per cent of this limited investment.
Similarly, while annual social expenditure is about 400 times greater in high-income countries than in low-income countries, the AAL in lowincome countries is equivalent to about 22 per cent of social expenditure, compared to only 1.45 per cent in high-income countries (Figure 3.10). Given that spending on social protection, public health and public education investment is critical to the Sustainable Development Goals, this
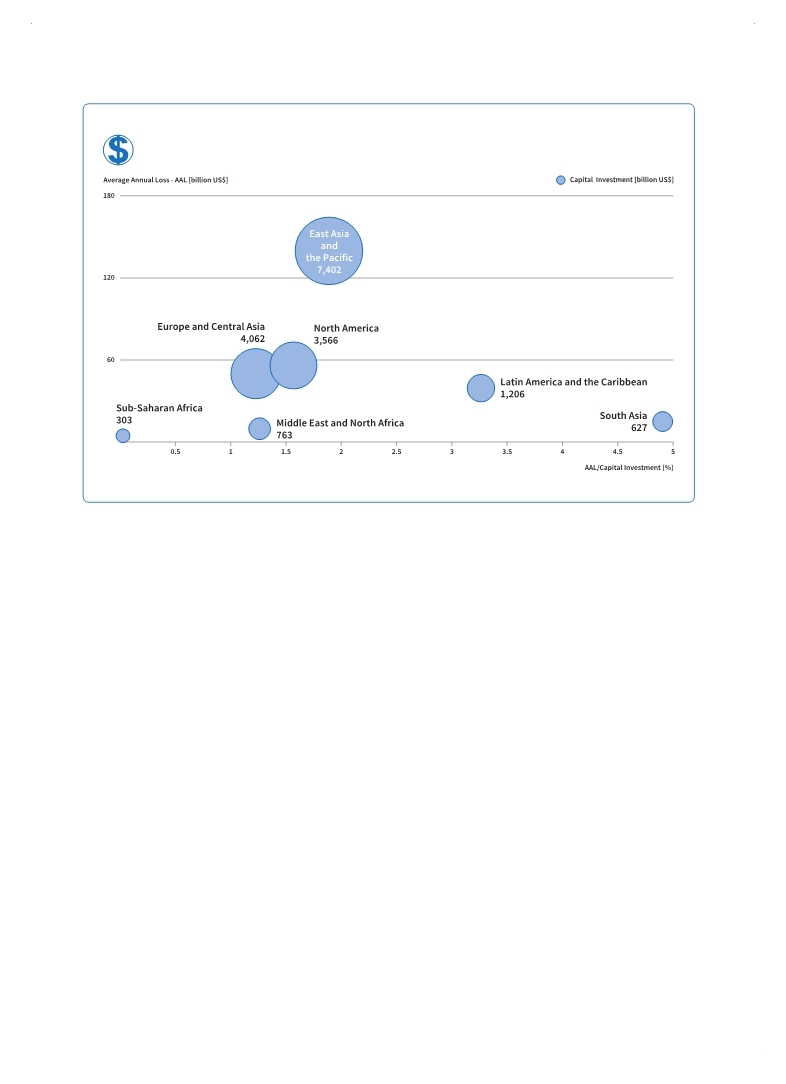
(Source: UNISDR with data from Global Risk Assessment and the World Bank.)
Figure 3.8 Multi-hazard average annual loss in relation to capital investment by geographical region
|
 
Page 1Page 10Page 20Page 30Page 40Page 50Page 52Page 53Page 54Page 55Page 56Page 57Page 58Page 59Page 60Page 61Page 62Page 63->Page 64Page 65Page 66Page 67Page 68Page 69Page 70Page 71Page 72Page 73Page 74Page 75Page 76Page 80Page 90Page 100Page 110Page 120Page 130Page 140Page 150Page 160Page 170Page 180Page 190Page 200Page 210Page 220Page 230Page 240Page 250Page 260Page 270Page 280Page 290Page 300Page 310
|
|
 
|
 
|