Global Assessment Report on Disaster Risk Reduction 2015
Making development sustainable: The future of disaster risk management |
Global Assessment Report on Disaster Risk Reduction 2015
Making development sustainable: The future of disaster risk management |
|
|
204
Part III - Chapter 10
short-term gains (UNISDR, 2013a
UNISDR. 2013a,Global Assessment Report on Disaster Risk Reduction: From Shared Risk to Shared Value: the Business Case for Disaster Risk Reduction, Geneva, Switzerland: UNISDR.. . This conundrum is compounded by the fact that the current measures of success for both private actors and governments are not compatible with goals such as equity and biocapacity. Where short-term profit and return on investment are key performance indicators, the risk generated by high-yielding investments elsewhere in society is ignored or discounted. If the main metric for success is GDP growth, questions of social equity or the growing gap between the ecological footprint and biocapacity recede into the background. Instead, this concern for economic growth often skews priorities, shifting government attention from serving its citizens to servicing its debt. At the end of 2010, outstanding sovereign debt totalled US$41 trillion globally (UNEP and Global Footprint Network, 2012
UNEP (United Nations Environment Programme) and Global Footprint Network. 2012,A New Angle on Sovereign Credit Risk E-RISC: Environmental Risk Integration in Sovereign Credit Analysis, Geneva.. . Avoiding regulation
In addition, tax havens and financial instruments that allow individuals, companies and governments to channel illicit funds or divert legal income to avoid levies, fees and taxes are beyond the reach of most forms of regulation. The scale of illegal financial flows and corruption is significant. The IMF estimates that offshore financial centres with limited jurisdiction held around US$5 trillion in assets and liabilities at the end of 2009, while in comparison the cross-border assets and liabilities of the United States, France and Germany combined amount to US$8 trillion (Gonzalez and Schipke, 2011
Gonzalez, Maria and Alfred Schipke. 2011,Bankers on the Beach, Finance & Development, June 2011: 42-45.. . Shaxson, Nicholas. 2012,Treasure Islands: Tax Havens and The Men Who Stole The World, Vintage Publisher.. . The 130th Assembly of the Inter-Parliamentary Union unanimously adopted a resolution on risk-resilient development in March 2014 which
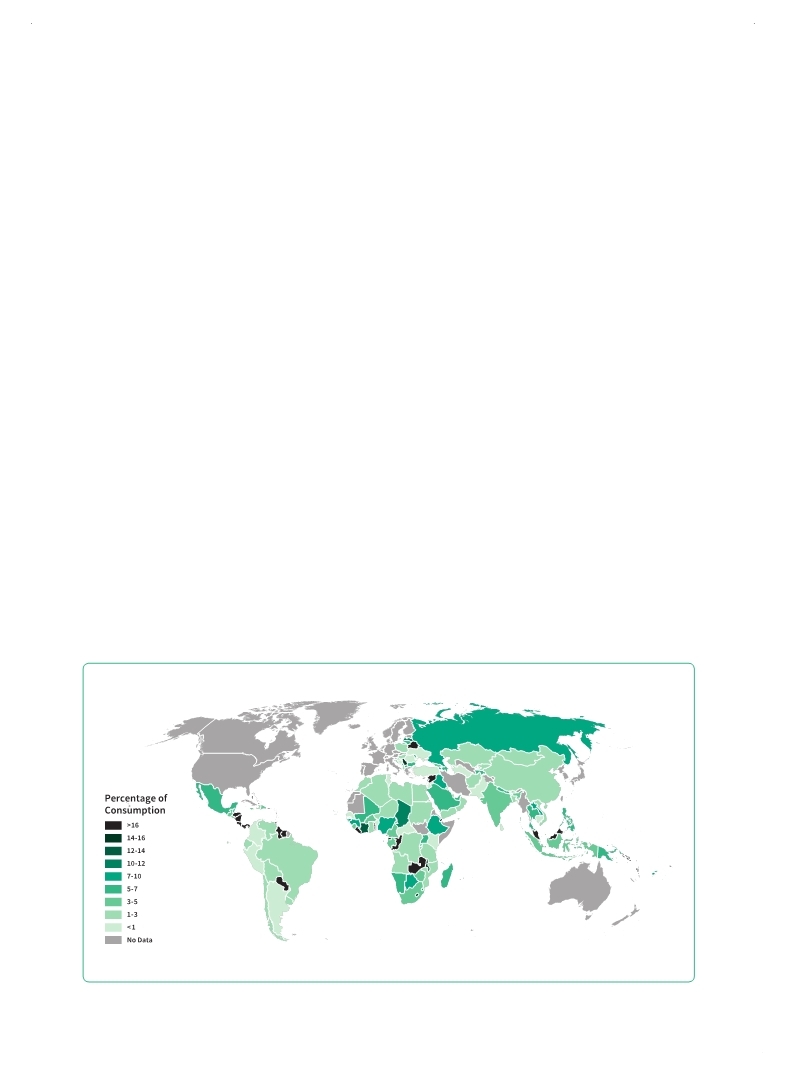
Figure 10.4 Illegal financial flows as a percentage of consumption
|
 
Page 1Page 10Page 20Page 30Page 40Page 50Page 60Page 70Page 80Page 90Page 100Page 110Page 120Page 130Page 140Page 150Page 160Page 170Page 180Page 190Page 194Page 195Page 196Page 197Page 198Page 199Page 200Page 201Page 202Page 203Page 204Page 205->Page 206Page 207Page 208Page 209Page 210Page 211Page 212Page 213Page 214Page 215Page 216Page 217Page 218Page 220Page 230Page 240Page 250Page 260Page 270Page 280Page 290Page 300Page 310
|
|
 
|
 
|