Please help us improve PreventionWeb by taking this brief survey. Your input will allow us to better serve the needs of the DRR community.


Further DRR country-level resources
The International Recovery Platform strengthens knowledge and information on building back better in recovery, rehabilitation, and reconstruction.
Explore the Knowledge Base
PreventionWeb's knowledge base contains more than 75,000 entries and is updated daily.

Explore all updates by their type: news, publications, resource guides and more.
Explore by the DRR theme: Human, economic, governance, science, environment and more.
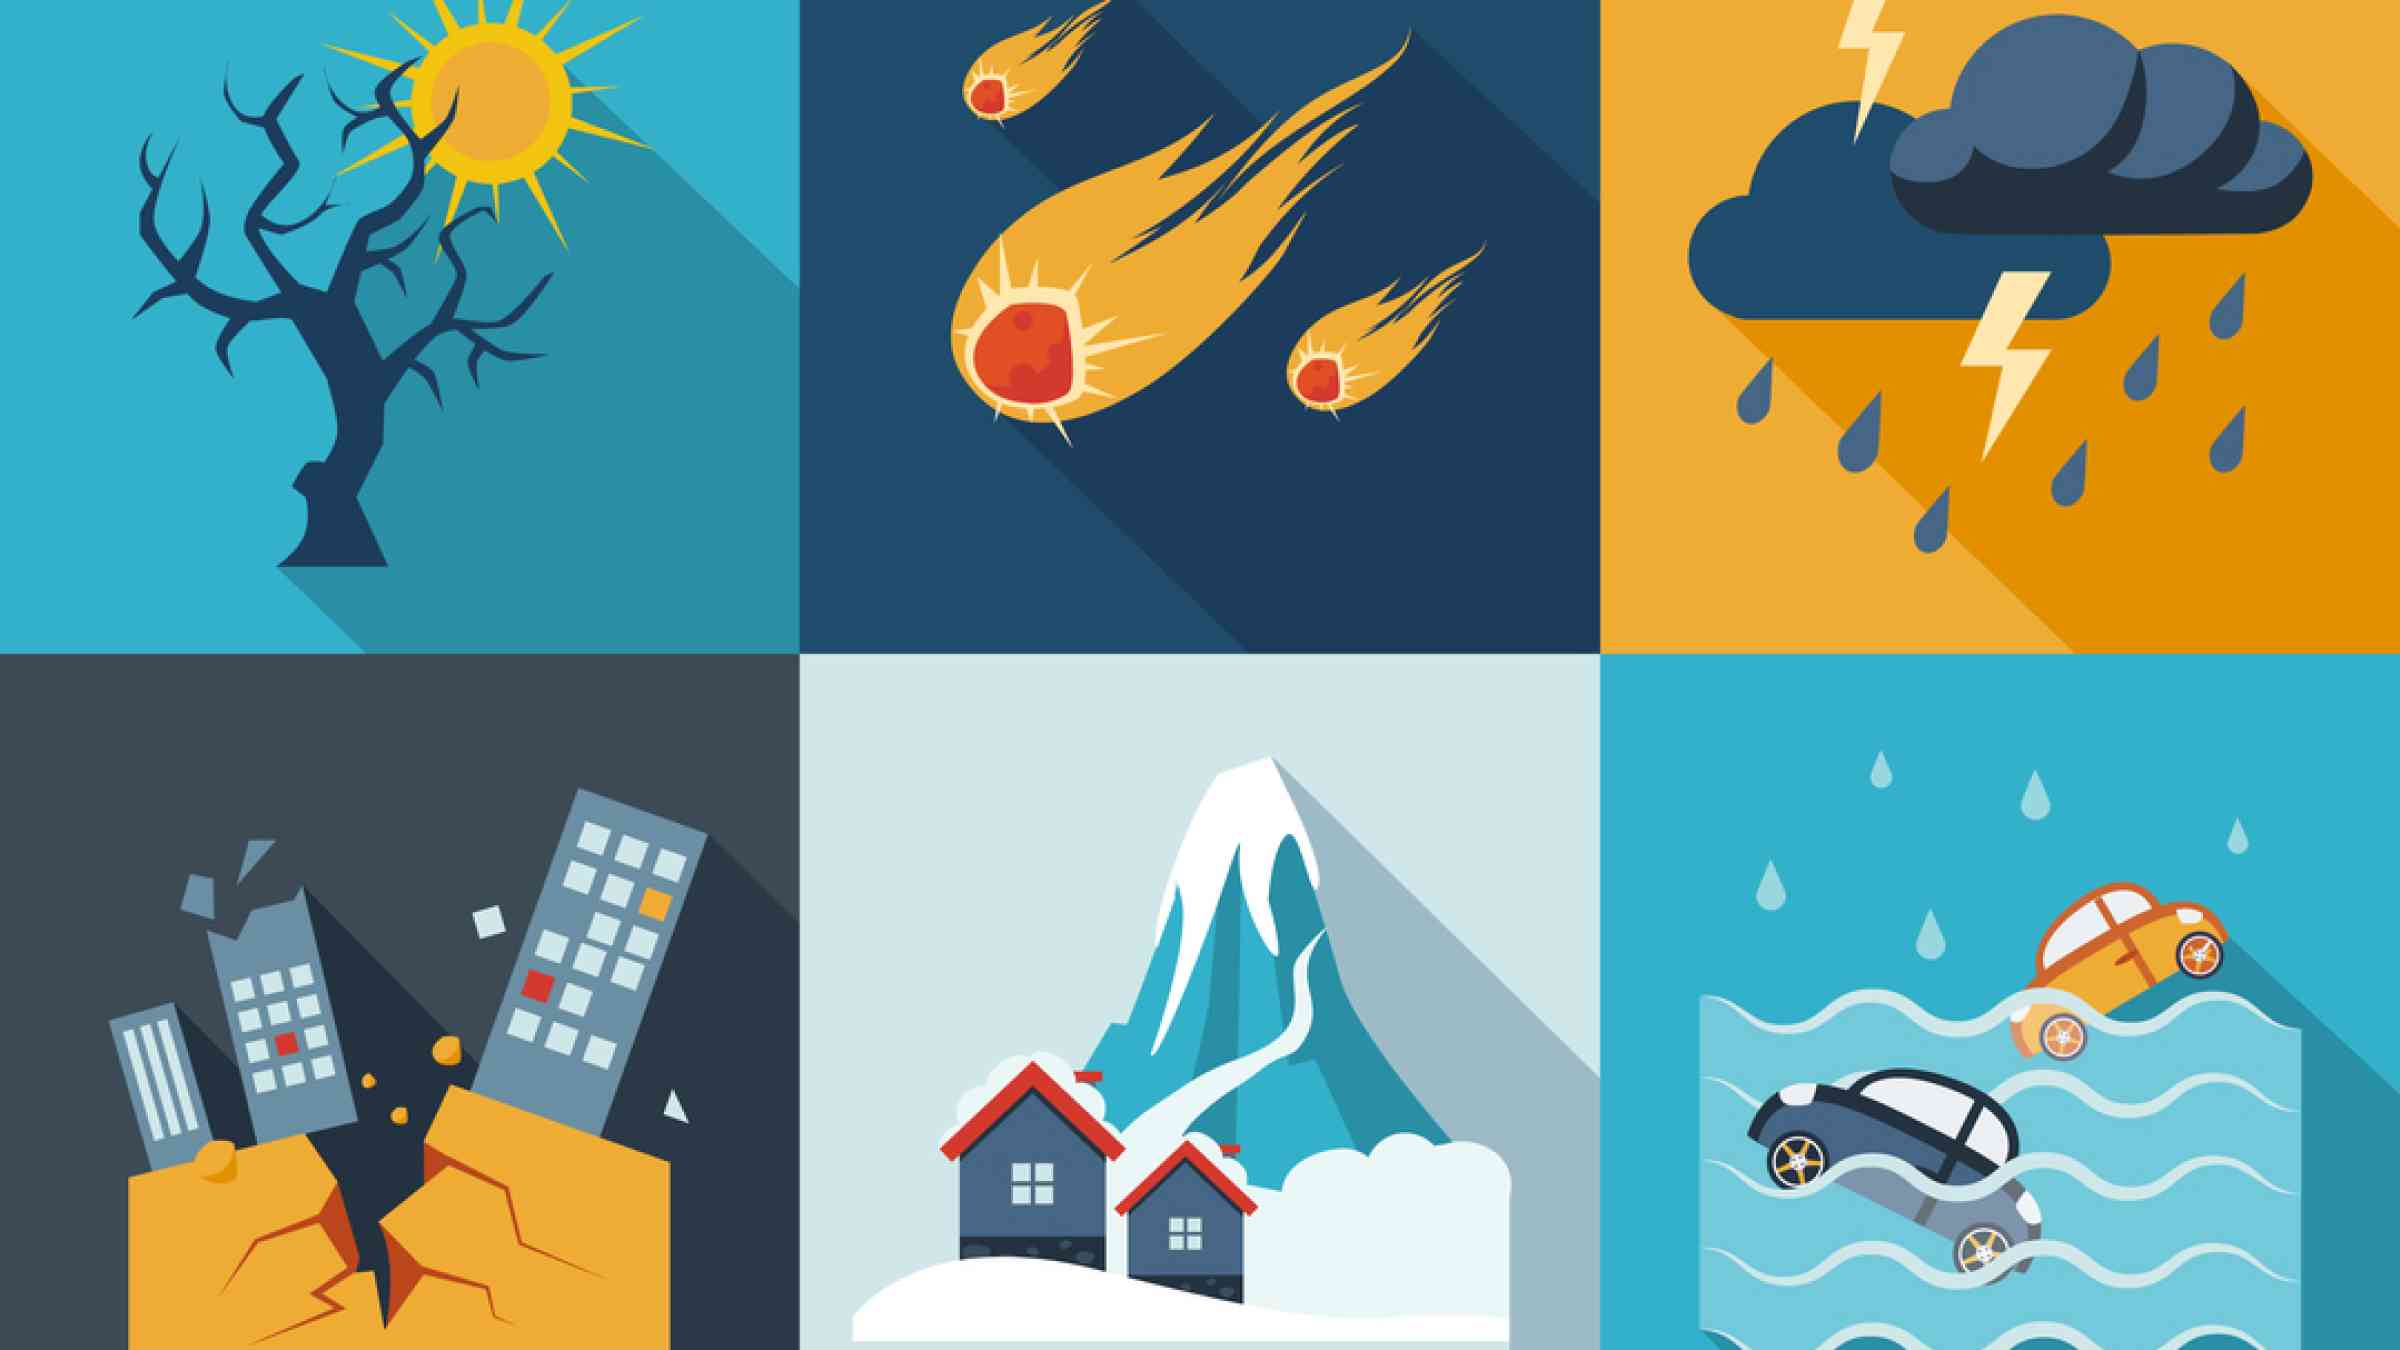
Explore by the hazard type: floods, heat, landslides, drought and more.
Explore DRR on a country and regional basis.

Keep up to date with various DRR topics and emerging trends.
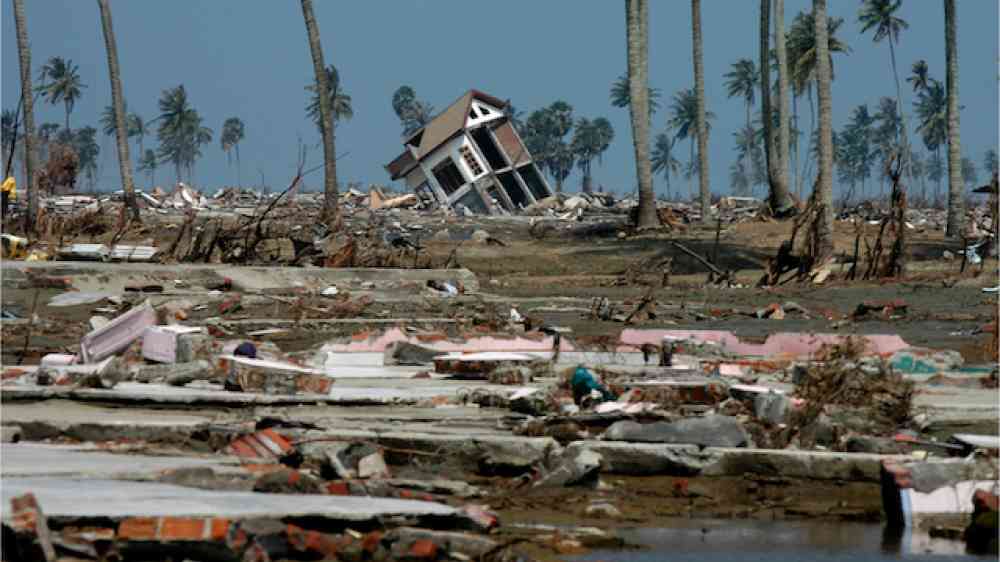
Take a look at the lessons learned from past disasters.
Is this page useful?
Yes No Report an issue on this pageThank you. If you have 2 minutes, we would benefit from additional feedback (link opens in a new window).